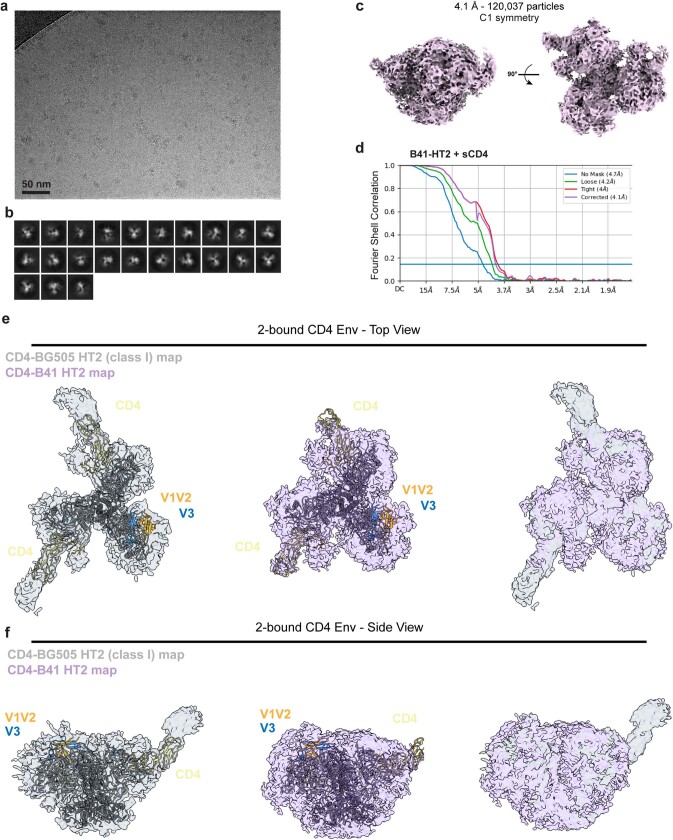
Extended Data Fig. 4. Cryo-EM data processing, validation, and interpretation for B41 HT2 in complex with CD4.
a, Representative micrograph (5,450 total), b, representative 2D classes, and c, density map for the CD4-B41 HT2 complex. d, Fourier shell correlation (FSC) plot of the final reconstruction for CD4-B41 HT2. e,f, Top-down (panel e) and side (panel f) views of class I CD4-BG505 HT2 model fit into class I CD4-BG505 HT2 (left) or CD4-B41 HT2 (middle) density maps and alignment of both density maps (right).

