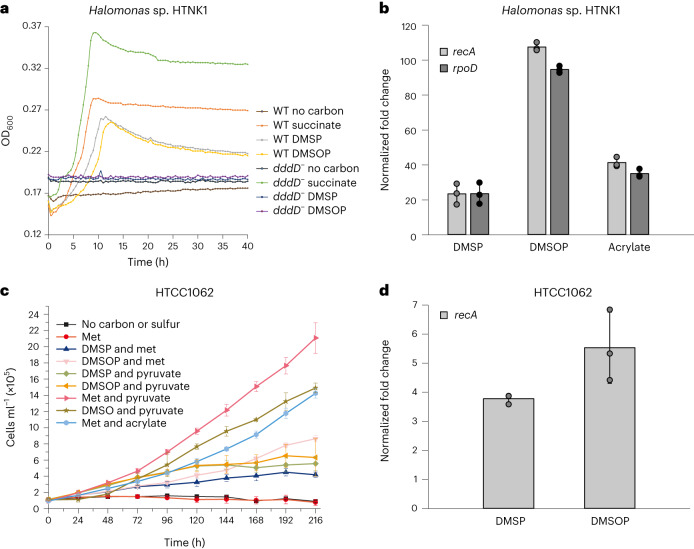
Fig. 4. Analysis of DMSOP cleavage by key bacterial strains.
a, Growth of Halomonas sp. HTNK1 WT and dddD− strains on succinate, DMSP or DMSOP as sole carbon source (2 mM). b, RT–qPCR analysis of Halomonas sp. HTNK1 dddD in cells incubated with succinate (control) and succinate plus DMSP, DMSOP or acrylate (5 mM). Transcription of dddD was normalized to recA and rpoD. c, Growth curves of P. ubique HTCC1062 with 100 µM of pyruvate, acrylate, DMSP or DMSOP as carbon source and 25 µM of DMSP, DMSOP, DMSO or methionine (Met) as sulfur source. d, RT–qPCR analysis of P. ubique HTCC1062 dddK in cells grown with pyruvate and Met only (control) or amended with 100 µM DMSOP and DMSP (Methods). Expression of dddK was normalized to recA. Data are presented as mean ± s.d. (n = 3).

