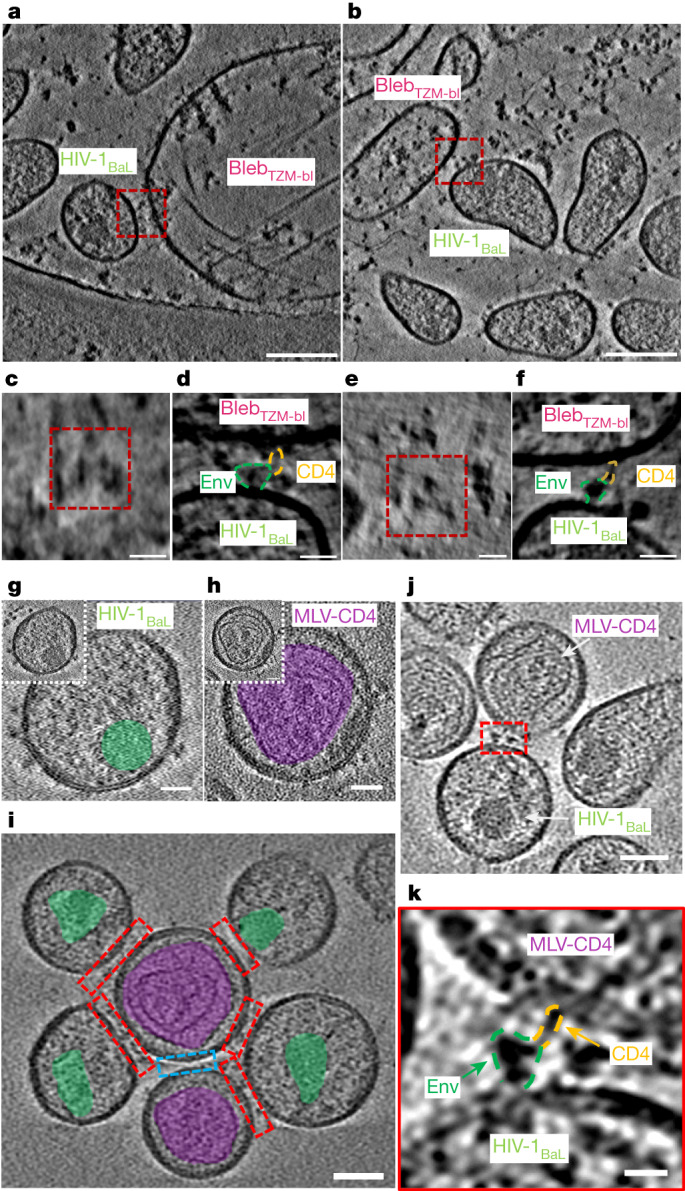
Fig. 1. Env–CD4 interactions are captured in biological membranes using cryo-ET.

a,b, Representative cryo-tomograms of membrane–membrane interfaces (red boxes) between HIV-1BaL viral particles and plasma membrane blebs generated from TZM-bl cells (blebTZM-bl). Scale bars, 100 nm. c,e, Top-down views of the membrane–membrane interfaces shown in a (c) and b (e), revealing Env clustering. Scale bars, 20 nm. d,f, Magnified images of the membrane–membrane interfaces shown in a (d) and b (f) depict Env–CD4 interactions in raw tomograms. Scale bars, 20 nm. g, Representative image of HIV-1BaL virus with Env on its surface. The capsid is highlighted in green. HIV-1BaL was inactivated with AT-2, resulting in less electron-dense capsids. Scale bars, 25 nm. h, Representative images of an MLV VLP carrying CD4 on its surface. The MLV capsid is highlighted in purple. Scale bars, 25 nm. i, A representative image of membrane–membrane interfaces (red boxes) in cryo-tomograms. Different capsid structures enable the identification of membrane–membrane interfaces as opposed to interfaces that do not have Env–CD4 interactions (blue box). Scale bar, 50 nm. j, A representative tomogram with the membrane–membrane interface highlighted in red. Scale bar, 50 nm. k, Magnified image of the membrane–membrane interface shown in j. Env–CD4 interactions are visible in raw tomograms. Scale bar, 10 nm.
