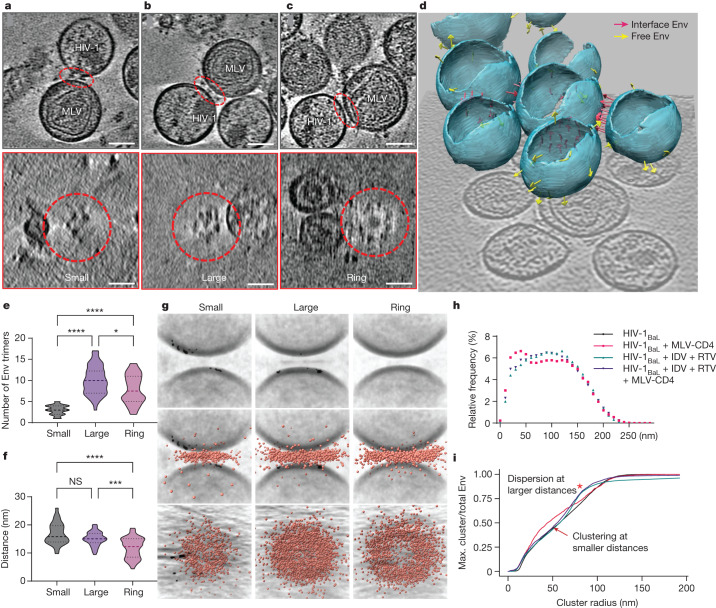
Fig. 2. HIV-1 Env binding to CD4 induces Env clustering and ring formation at membrane–membrane interfaces.
a–c, Representative tomograms of small (a), large (b) and ring (c) Env cluster formations. The interfaces are indicated by red dashed ovals. Bottom, top-down views of each interface, revealing Env clustering. Scale bars, 50 nm. d, Three-dimensional representation of viral particles in a representative tomogram. The pink arrows represent Env trimers at membrane–membrane interfaces. The yellow arrows represent free Env trimers on the surface of HIV-1BaL. e, The number of Env trimers present at interfaces in each clustering pattern. Mean ± s.d. = 3.0 ± 1.1 (small), 10.0 ± 3.4 (large) and 7.9 ± 3.4 (ring). *P = 0.0478, ****P < 0.0001. f, The distance between the membranes at the interfaces for each clustering pattern. Mean ± s.d. = 16.9 ± 3.8 nm (small), 15.1 ± 2.4 nm (large) and 11.9 ± 3.6 nm (ring). NS, P = 0.4178; ***P = 0.0002, ****P < 0.0001. g, Subtomogram-averaged interfaces from small, large and ring clusters. Individual subtomograms of the membrane–membrane interfaces from each class were aligned, and the coordinates of Env–CD4 complexes were overlaid and displayed as side and top-down views (middle and bottom, respectively). h,i, Clustering analysis of Env trimers on the surface of mature (black) and immature HIV-1BaL particles alone (green, prepared by treating virus-producing cells with the protease inhibitors indinavir (IDV) and ritonavir (RTV)), and mature (red) and immature (purple) HIV-1BaL particles mixed with MLV-CD4 VLPs. h, Histogram profile of the arc distances between Env trimers on the surface of particles. i, Multidistance spacial cluster analysis of the ratio of the largest number of Env trimers with increasing cluster radii to the total Env trimers on each viral particle. Env clustering (arrow) and dispersion (red asterisk) are indicated. Max., maximum.

