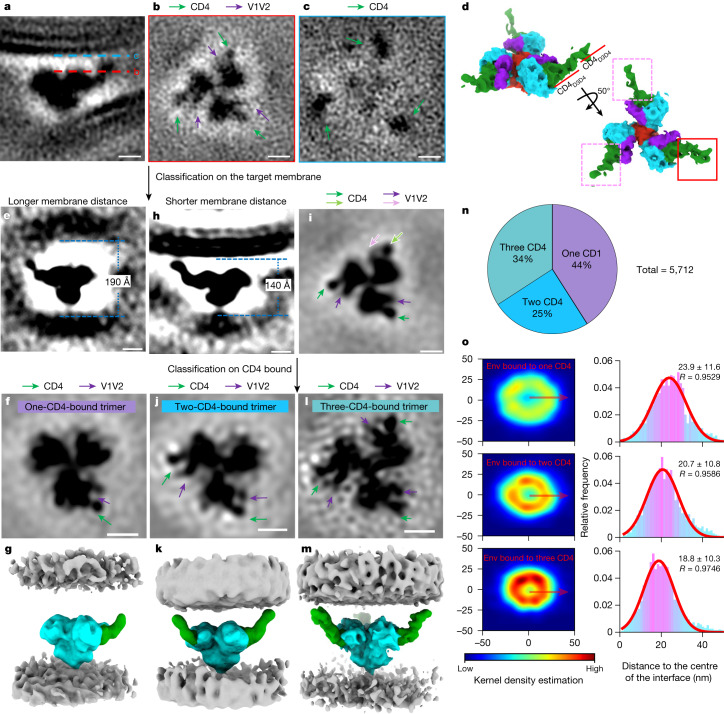
Fig. 3. Subtomogram averaging and classification reveal intermediates with HIV-1 Env trimers bound to one, two and three CD4 receptor molecules.
a–c, Side view (a) of the subtomogram average of the Env–CD4 complex at the membrane–membrane interfaces. The dotted lines indicate the positions of the top-down view slices in b (red) and c (blue). The densities of CD4 and V1V2 loops are labelled in green and purple, respectively. d, Segmentation of the Env–CD4 average structure. Side view (top) and top view (bottom) of Env (cyan) bound by three CD4 molecules (green). V1V2 loops are shown in purple and gp41 is shown in red. The CD4 molecule with strong density is indicated by a red box; the two CD4 molecules with weaker densities are indicated by pink boxes. e–g, Subclass average for longer membrane distance (190 Å) after focused classification on the target membrane. Side view (e), top view (f) and segmentation (g) are shown. h,i, Subclass average for shorter membrane distance (140 Å) after focused classification on the target membrane. Side view (h) and top view (i) are shown. The distinctive V1V2 loop and CD4 densities are indicated by pink and light green arrows, respectively. j–m, Focused classification on CD4 binding was performed in the subclass with a shorter membrane distance (h,i). Subclass averages of Env bound to two CD4 (j,k) and three CD4 molecules (l,m) are shown as top views (j,l) and segmentations (k,m). n, The proportion of Env trimers bound to one, two or three CD4 molecules. o, Distribution analysis of Env bound to one, two or three CD4 molecules at the interfaces. The kernel density heat map shows the 2D distribution of Env from the interface centre. The histograms show Env distances to the interface centre fitted with Gaussian curves (mean and R values are indicated). In the segmentations, Env is shown in cyan and CD4 is shown in green. Membranes are shown in grey. For a–c, e, f, h–j and l, scale bars, 5 nm.

