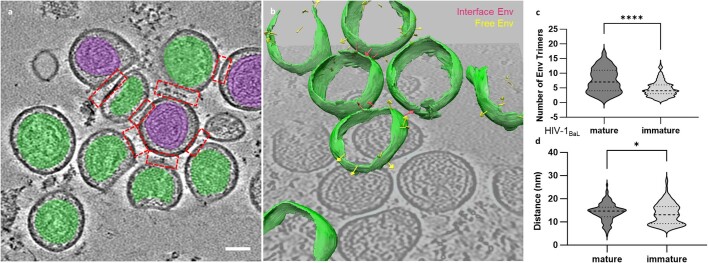
Extended Data Fig. 2. Env-CD4 interactions at the membrane-membrane interfaces between immature HIV-1BaL particles and MLV-CD4 VLPs.
a A representative tomogram showing immature HIV-1BaL particles and MLV-CD4 VLPs. HIV-1 capsids are noted in green and MLV capsids are noted in purple. Scale bar = 50 nm. b Three-dimensional representation of immature HIV-1BaL particles and MLV-CD4 VLPs in a representative tomogram. Pink arrows represent Env trimers at membrane-membrane interfaces. Yellow arrows represent free Env trimers on the surface of the HIV-1BaL particles. c The number of Env trimers present at membrane-membrane interfaces for mature and immature HIV-1BaL particles mixed with MLV-CD4 VLPs. Mature HIV-1BaL mean ± s.d. = 7.5 ± 4. Immature HIV-1BaL mean ± s.d. = 4.6 ± 2.5. P-value **** = <0.0001. d The distance between membranes at membrane-membrane interfaces with mature and immature HIV-1BaL particles mixed with MLV-CD4 VLPs. Mature HIV-1BaL mean ± s.d. = 14.3 nm ± 3.8 nm. Immature HIV-1BaL mean ± s.d. = 13.5 nm ± 4.6 nm. * = 0.0420.

