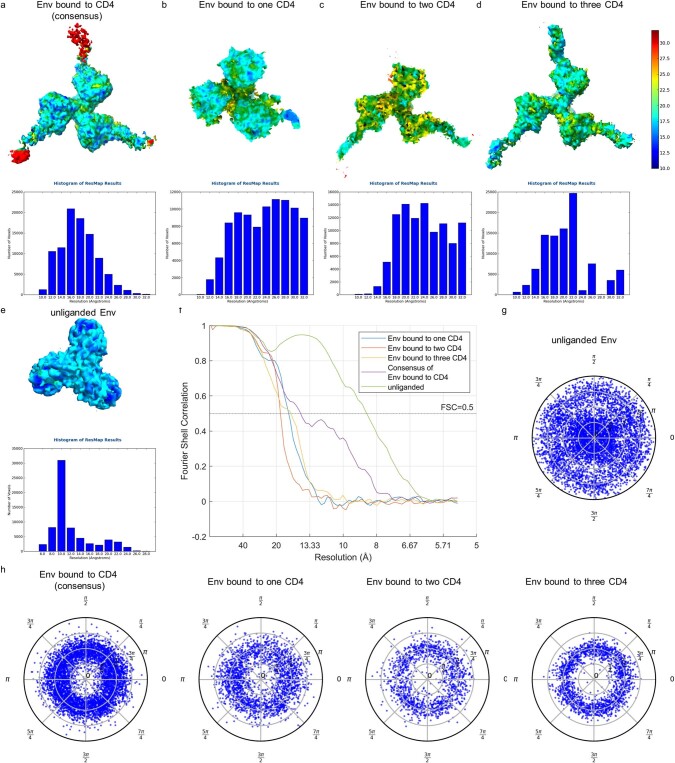
Extended Data Fig. 4. Resolution assessment of subtomogram averaged structures.
a–e Local resolution estimation using ResMap software for the structures of the Env-CD4 complex. The structures and ResMap histograms of the consensus average (a), Env trimer bound to one CD4 molecule (b), Env trimer bound to two CD4 molecules (c), Env trimer bound to three CD4 molecules (d) and unliganded Env trimer from the same dataset (e) are shown. Subtomogram averages are coloured according to the local resolution as indicated on the scale on the right. f Fourier shell correlation (FSC) curves for cryo-ET masked subtomogram averages with FSC = 0.5 as the cutoff value. g–h. The distribution of orientations for aligned Env particles. The unliganded Env particles are evenly distributed across all orientations (g). The Env particles bound to CD4 molecules showed reduced numbers of top-view and bottom-view particles (h). This is likely because the Env-CD4 complexes are located at the interface between two viruses, resulting in a higher occurrence of side-view orientations.

