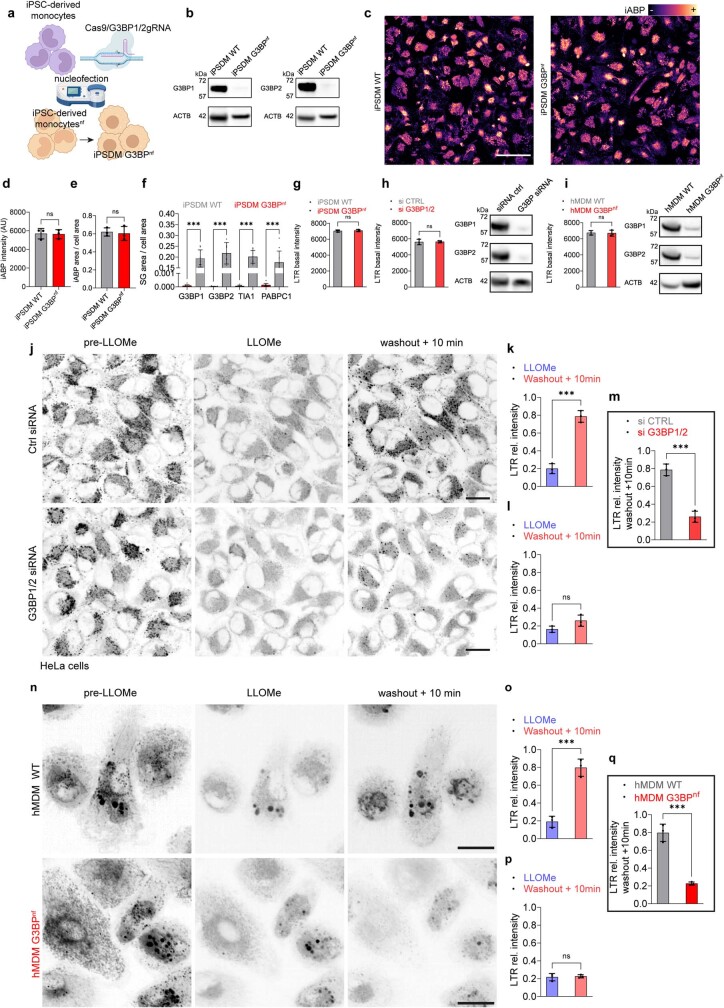
Extended Data Fig. 6. Supplementary data related to Fig. 3.
a, Scheme showing the experimental workflow targeting G3BP1 and G3BP2 using CRISPR/Cas9 system delivered as a ribonucleoprotein (RNP) complex by nucleofection. b, immunoblot showing G3BP1 and G3BP2 protein levels in iPSDM WT and iPSDM G3BPnf, ACTB was used as a loading control (n = 3). c, representative images of proteolytic activity (magma colormap) in iPSDM WT and iPSDM G3BPnf incubated with the pan-cathepsin activity-based probe (iABP). Scale bar: 20 μm. d,e, Bar plots show iABP intensity quantification (d) and lysosomal area per cell evaluation (e) in iPSDM WT and iPSDM G3BPnf, n = 3 independent experiments. f, high-content imaging SG evaluation in iPSDM WT and iPSDM G3BPnf left untreated or treated with LLOMe (1 mM, 30 min). Bar plots represent mean values ± SEM of one out of three independent experiments (n = 3), ***P < 0.001, two-way ANOVA, Šídák’s multiple comparisons test. g, LysoTracker basal intensity quantification of iPSDM WT and iPSDM G3BPnf, n = 3 independent experiments. h-i, LysoTracker basal intensity quantification and immunoblot showing G3BP1 and G3BP2 protein levels in HeLa WT and HeLa G3BP1/2 knockdown (KD) cells (h), and in hMDM WT and hMDM G3BPnf (i), ACTB was used as a loading control, n = 3 independent experiments. j, Image sequence of iPSDM WT and iPSDM G3BPnf incubated with LysoTracker (seen as black puncta) before adding LLOMe (left panel), 2 min after (central panel) and 10 min after washout (left panel). Scale bar: 10 μm. k-l, Show quantification of LTR puncta intensity relative to basal values (pre-LLOMe) for the indicated conditions in HeLa WT (k) and HeLa KD (l), n = 3 independent experiments, ***P < 0.001, two-tailed t-test. m, Shows the LTR intensity at 10 min after washout in HeLa WT compared to HeLa KD, n = 3 independent experiments. ***P < 0.001, two-tailed t-test. n, Image sequence of hMDM WT and hMDM G3BPnf incubated with LysoTracker (seen as black puncta) before adding LLOMe (left panel), 2 min after (central panel) and 10 min after washout (left panel). Scale bar: 10 μm. o-p, Show quantification of LTR puncta intensity relative to basal values (pre-LLOMe) for the indicated conditions in hMDM WT (o) and hMDM G3BPnf (p), n = 3 independent experiments. ***P < 0.001, two-tailed t-test. q, Shows the LTR intensity at 10 min after washout in hMDM WT compared to hMDM G3BPnf, n = 3 independent experiments. ***P < 0.001, two-tailed t-test. Bar plots show mean ± SEM. For gel source data, see Supplementary Fig. 1.

