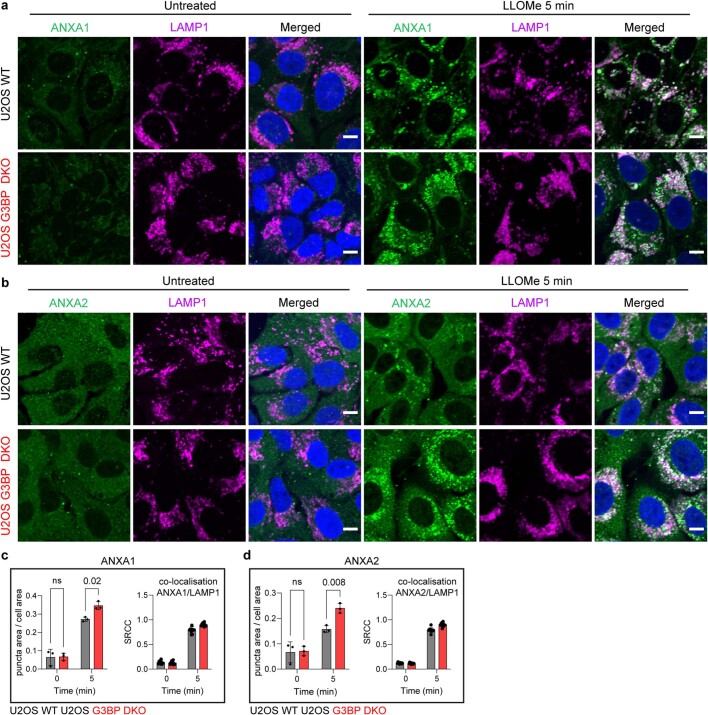
Extended Data Fig. 9. Evaluation of ANXA1 and ANXA2 in U2OS WT and U2OS G3BP double knockout cells after lysosomal damage.
a,b, Representative images of U2OS WT and U2OS G3BP DKO cells left untreated or treated with LLOMe (2 mM) for 5 min and stained for LAMP1 and the lysosomal repair-related proteins ANXA1 (a) and ANXA2 (b). c,d, High-content image quantification (n ≥ 300 cells) of ANXA1 (c) and ANXA2 (d) puncta area per cell of cells treated as in (a,b). The graph on the right shows the corresponding co-localisation results with the lysosomal marker LAMP1. Data represent the mean ± SEM. n ≥ 900 cells examined over three independent experiments. P-value was calculated using a two-way ANOVA, Šídák’s multiple comparisons test. Scale bar: 10 μm.

