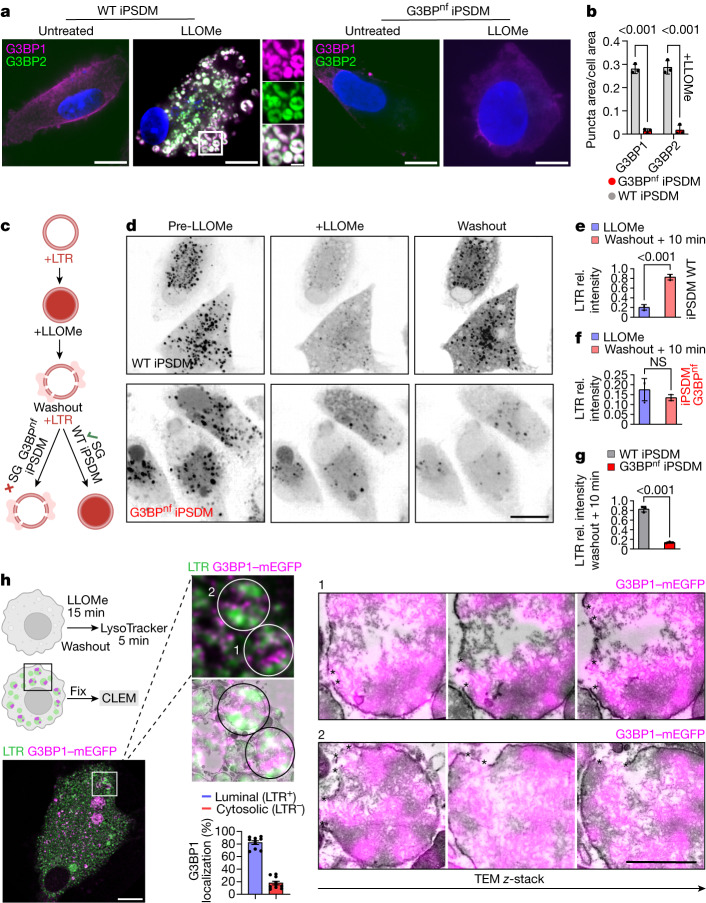
Fig. 3. Stress granules facilitate endomembrane repair.
a, G3BP1 and G3BP2 staining in wild-type and G3BPnf iPSDMs left untreated or treated with LLOMe (1 mM, 30 min). n = 3 independent experiments. Scale bars: 10 μm (main images), 2 μm (enlarged area). b, Stress granule quantification in iPSDMs treated as described in a. n = 30 cells examined over 3 independent experiments. Two-way ANOVA with Šídák’s multiple comparisons test. c, Schematic illustrating the lysosomal recovery assay using LysoTracker (LTR). d, Image sequence of wild-type and G3BPnf iPSDMs incubated with LysoTracker (black puncta) before adding LLOMe (left), and 2 min (middle) or 10 min after (right) washout. Scale bar, 10 μm. e,f, Intensity of LysoTracker puncta relative (rel.) to basal values (pre-LLOMe) for the indicated conditions in wild-type (e) and G3BPnf (f) iPSDMs. n = 3 independent experiments. Two-tailed t-test. g, LysoTracker intensity at 10 min after washout in wild-type iPSDMs compared with G3BPnf iPSDMs. Data are mean ± s.e.m. n = 3 independent experiments. Two-tailed t-test. h, Schematic of the CLEM experiment on recovered lysosomes. mEGFP–G3BP1 (magenta) iPSDMs were treated with LLOMe (1 mM) for 15 min. After a washout step, cells were incubated with LysoTracker (green) before fixation and CLEM processing. Bottom right, percentage of G3BP1+ puncta localizing to LysoTracker+ and LysoTracker− areas, quantified by electron microscopy. n ≥ 10 fields of view over 3 independent experiments. The image sequence shows the G3BP1+LysoTracker+ regions of interest (1 and 2) analysed by CLEM and the corresponding fluorescence–electron microscopy image overlap across three different regions in z (serial stack). Arrowheads indicate G3BP1+ areas surrounding membrane disruption sites. NS, not significant.

