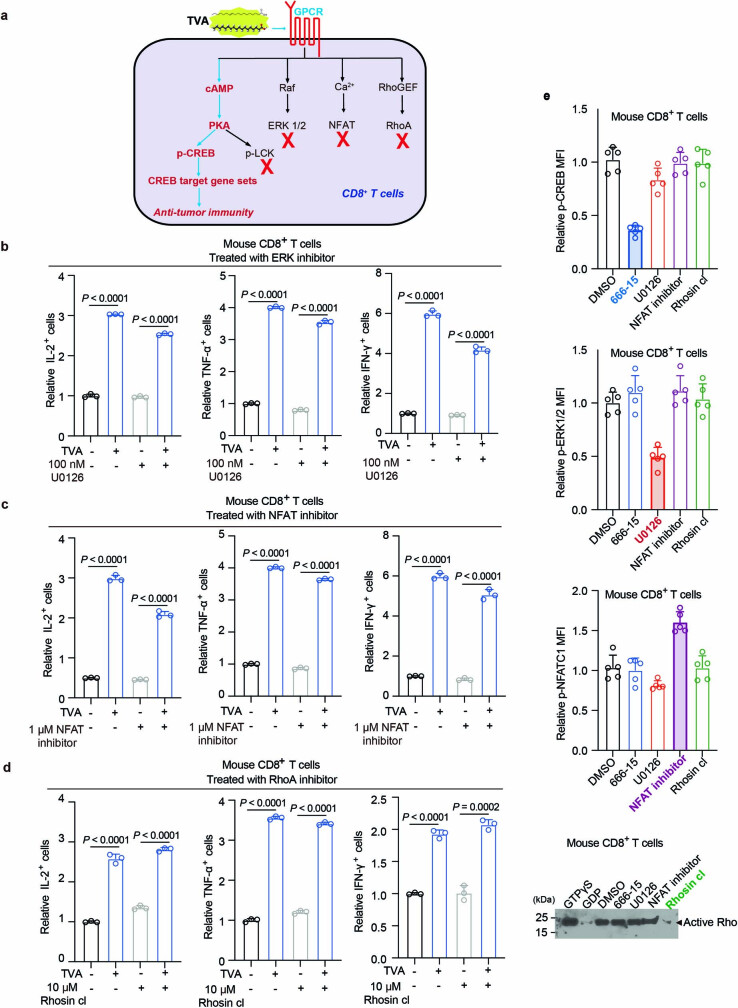
Extended Data Fig. 6. TVA functions through the cAMP-PKA-CREB axis but not other downstream effector pathways of GPCR.
a, Summary of TVA-GPCR downstream signaling changes induced by TVA in CD8+ T cells. The red fork means no change. b, c, d, Effect of treatment with ERK inhibitor U0126 (b), NFAT inhibitor (c), or RhoA inhibitor Rhosin cl (d) on relative IL-2 (left), TNF-α (middle), and IFN-γ (right) levels in mouse CD8+ T cells treated with or without TVA (n = 3). e, Validation of CREB, ERK, NFAT, and RhoA inhibitors effects at the concentrations used, GTPγS (positive control) and GDP (negative control) were used to ensure the pull-down procedures worked properly (n = 5). For gel source data, see Supplementary Fig. 2. Data are mean ± SD (b-e). Student’s two-sided unpaired t test (b-e).

