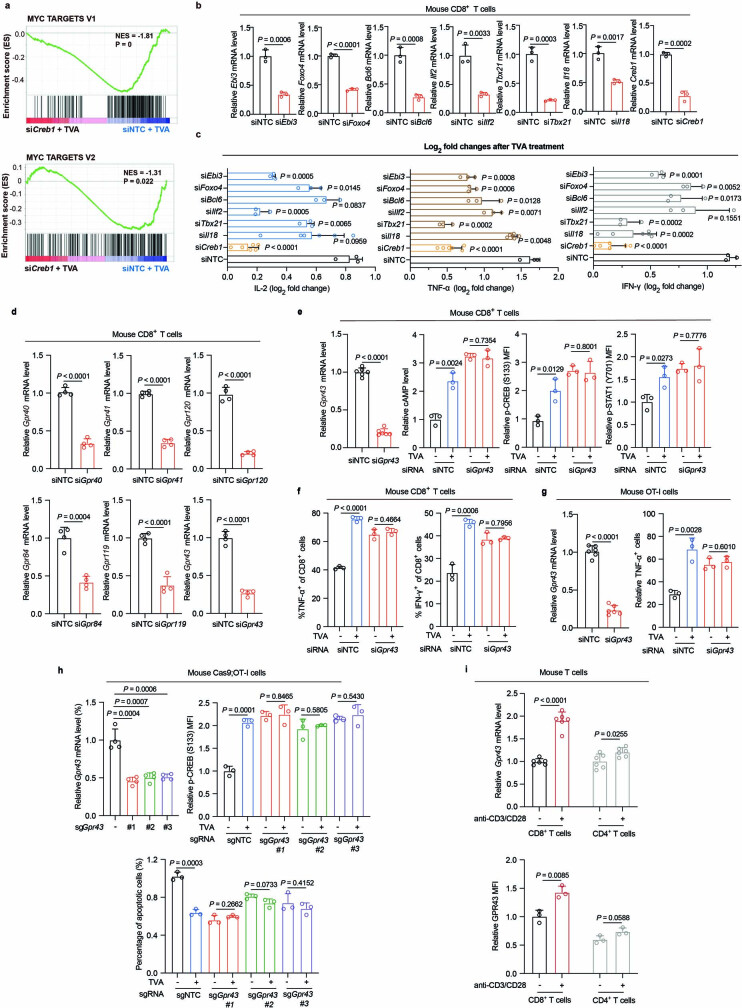
Extended Data Fig. 8. TVA-enhanced CD8+ T cell function requires the GPR43-CREB axis.
a, GSEA of upregulated MYC targets V1 (upper) and MYC target V2 (lower) in siNTC with TVA treatment compared to siCreb1 with TVA treatment. NES, normalized enrichment score. b, Ebi3, Foxo4, Bcl6, Ilf2, Tbx21, IL18, and Creb1 knockdown efficiency checked by RT-PCR (n = 3). c, TVA-Creb1 target genes validation: Log2 fold changes of IL-2 (left), TNF-α (middle), and IFN-γ (right) after TVA treatment in CD8+ T cells with individually transient knockdown of Creb1, Il18 (n = 6), Tbx21, Ilf2, Bcl6, Foxo4, and Ebi3 (n = 3). d, Gpr40, Gpr41, Gpr120, Gpr84, Gpr119, and Gpr43 knockdown efficiency checked by RT-PCR (n = 4). e, Gpr43 knockdown efficiency in CD8+ T cells was checked by RT-PCR (left) (n = 6). Effects of Gpr43 transient knockdown on cAMP (middle left), p-CREB (middle right), and p-STAT1 (right) levels in mouse CD8+ T cells treated with or without TVA were shown (n = 3). f, Effects of Gpr43 transient knockdown on TNF-α (left) and IFN-γ (right) levels in mouse CD8+ T cells treated with or without TVA (n = 3). g, Gpr43 knockdown efficiency in OT-I cells was checked by RT-PCR (left). Effect of Gpr43 transient knockdown on TNF-α level (right) in OT-I cells treated with or without TVA was shown (n = 3). h, Knockout efficiency of Gpr43 in Cas9;OT-I cells was checked by RT-PCR (upper left) (n = 4). Effects of individually knockout of Gpr43 with three sgRNAs on p-CREB level (upper right) and apoptosis (lower) in mouse Cas9;OT-I cells treated with or without TVA were shown (n = 3). i, Relative Gpr43 mRNA level (n = 6) and protein level (n = 3) in CD8+ T cells and CD4+ T cells with or without anti-CD3/CD28 stimulation. Data are mean ± SD (b-i). Nominal P values were adjusted by the Benjamini–Hochberg method (a), Student’s two-sided unpaired t test (b-i).

