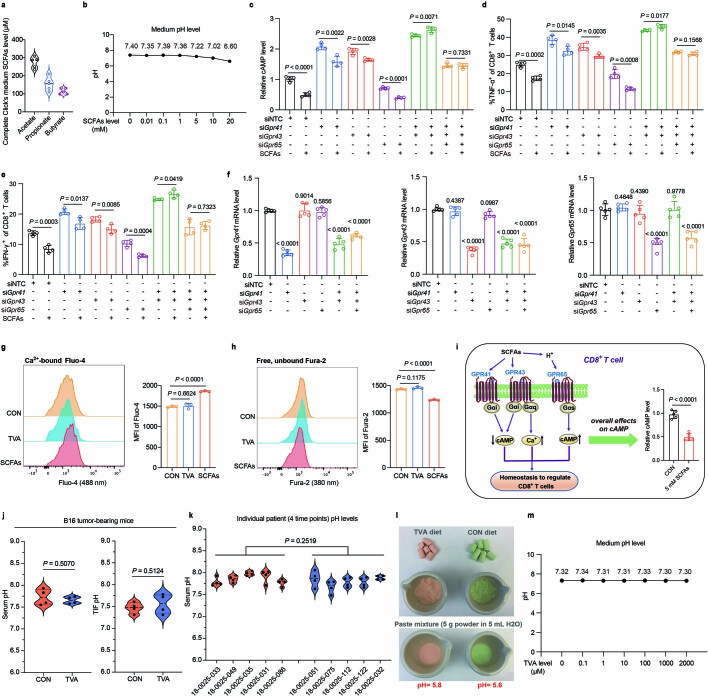
Extended Data Fig. 11. SCFAs affect mouse CD8+ T cell activity through GPR41, GPR43, and GPR65.
a, SCFAs level in Click’s medium (n = 5). b, Medium pH level with different doses of SCFAs. c, Effects of Gpr41, Gpr43, and Gpr65 transient knockdown on cAMP level in mouse CD8+ T cells treated with or without SCFAs (n = 4). d, Effect of Gpr41, Gpr43, and Gpr65 transient knockdown on TNF-α level in mouse CD8+ T cells treated with or without SCFAs (n = 4). e, Effect of Gpr41, Gpr43, and Gpr65 transient knockdown on IFN-γ level in mouse CD8+ T cells treated with or without SCFAs (n = 4). f, Gpr41 (left), Gpr43 (middle), and Gpr65 (right) knockdown efficiency checked by RT-PCR (n = 5). g, Flow cytometry and quantification of Ca2+-bound Fluo-4 level (n = 3). h, Flow cytometry and quantification of free unbound Fura-2 level (n = 3). i, Working model of effect of SCFAs on cAMP level in CD8+ T cells (n = 5). The figure was generated using BioRender. j, pH level of B16F10 tumor-bearing mouse serum (left) and TIF (right) (n = 4). k, Serum pH level of 10 lymphoma patients that have undergone commercial CAR-T cell therapy. Each patient has blood collections at 4 different timepoints (detailed information can be found in Supplementary Table 8). l, pH levels of TVA and CON diet. m, Medium pH level with different doses of TVA. Data are mean ± SD (a, c-k). Student’s two-sided unpaired t test (a, c-k).

