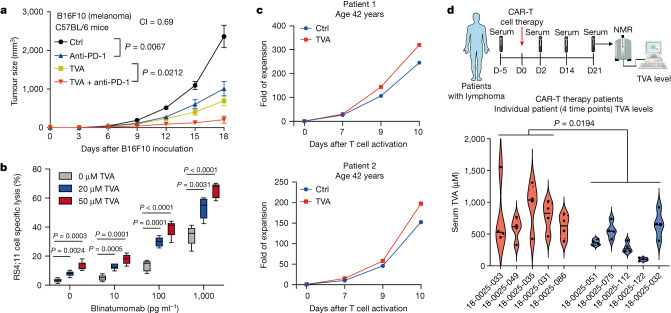
Fig. 5. TVA augments the effectiveness of multiple T cell-based anti-cancer therapies.
a, Effect of anti-PD-1 antibody on B16F10 tumour growth in C57BL/6 mice fed with TVA-enriched diet or control diet (n = 8). b, Box plots representing combined effect of blinatumomab and TVA at indicated concentrations on specific lysis of RS4;11 target cells in the presence of PBMCs by flow cytometry (n = 5). The central line is the mean, whiskers extend to minimum and maximum values and the box edges show mean ± s.d. c, Effects of treatment with 20 µM TVA on in vitro expansion of anti-CD19–CD28z CAR-T from patients with lymphoma. d, Top, schematic depicting experimental design for serum collection from patients with CAR-T cell therapy. This schematic was generated using BioRender.com. Bottom, violin plots showing serum TVA levels of 10 patients with lymphoma who have undergone commercial CAR-T cell therapy. Blood was collected from each patient at four different timepoints (detailed information can be found in Supplementary Table 8). Red violin plots represent the patients who have complete response to CAR-T cell therapy, and blue violin plots represent patients who have progressive disease under CAR-T cell therapy. Data are mean ± s.e.m (a) or mean ± s.d. (b,d). Two-way ANOVA (a) or Student’s two-sided unpaired t-test (b,d).

