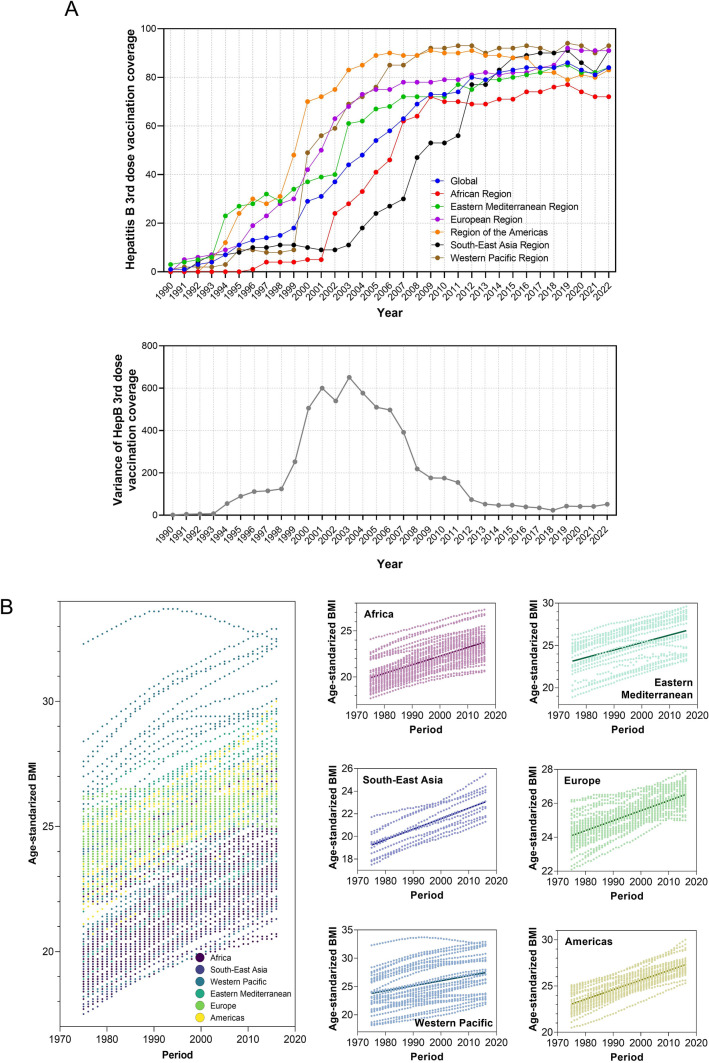
Fig. 9.
The globalization of the cancer etiology (vaccination and high BMI). A An example of protective factor (hepatitis B 3rd dose vaccination), where the upper figure shows the vaccination coverages among six WHO regions and the lower figure calculates the variances among six WHO regions according to their coverage statistics. B An example of risk factor (age-standardized BMI values), where linear regression relationships between BMI level and year were established for six WHO regions (point estimation and their 95% CI: AFR, 0.09401 [0.08886, 0.09916]; AMR, 0.1037 [0.09957, 0.1077]; EMR, 0.08777 [0.07614, 0.09940]; EUR, 0.05910 [0.05683, 0.06138]; SEAR, 0.09294 [0.08429, 0.1016]); WPR, 0.08932 [0.07200, 0.1066])

