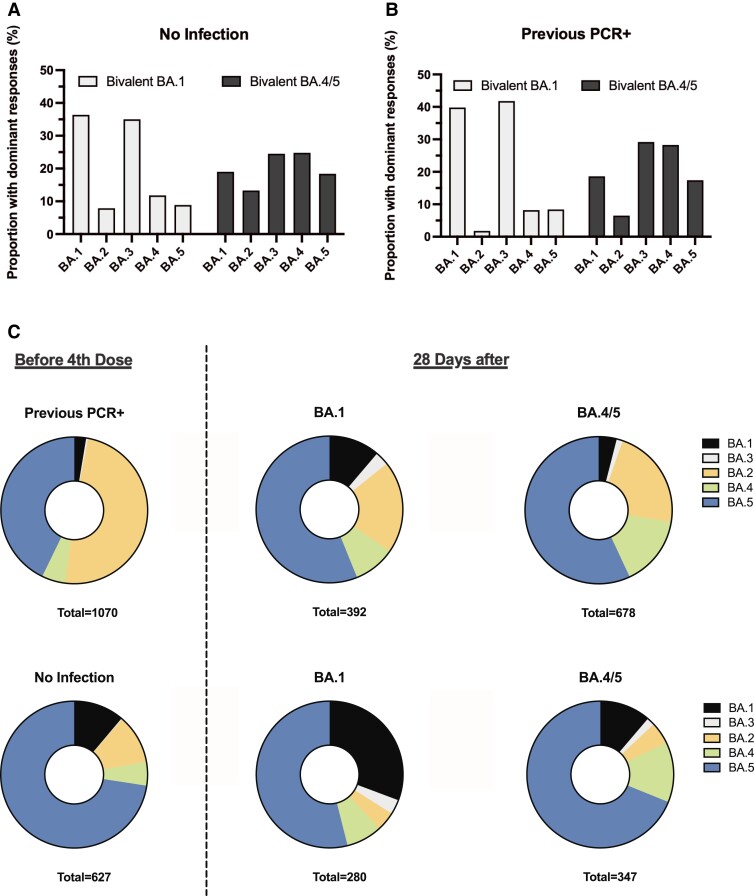
Figure 4.
Proportion of participants with dominant responses to the 5 Omicron antigens BA.1 to BA.5. A, Panel shows the dominant induced responses in participants with no prior infection following bivalent BA.1 and BA.4/5 vaccination. B, Panel shows the dominant induced responses in participants with a previous PCR+ infection following bivalent BA.1 and bivalent BA.4/5 vaccination. C, Panel shows pie charts with the proportion of participants with dominant serological responses before and after the bivalent fourth vaccine dose. Abbreviation: PCR, polymerase chain reaction.

