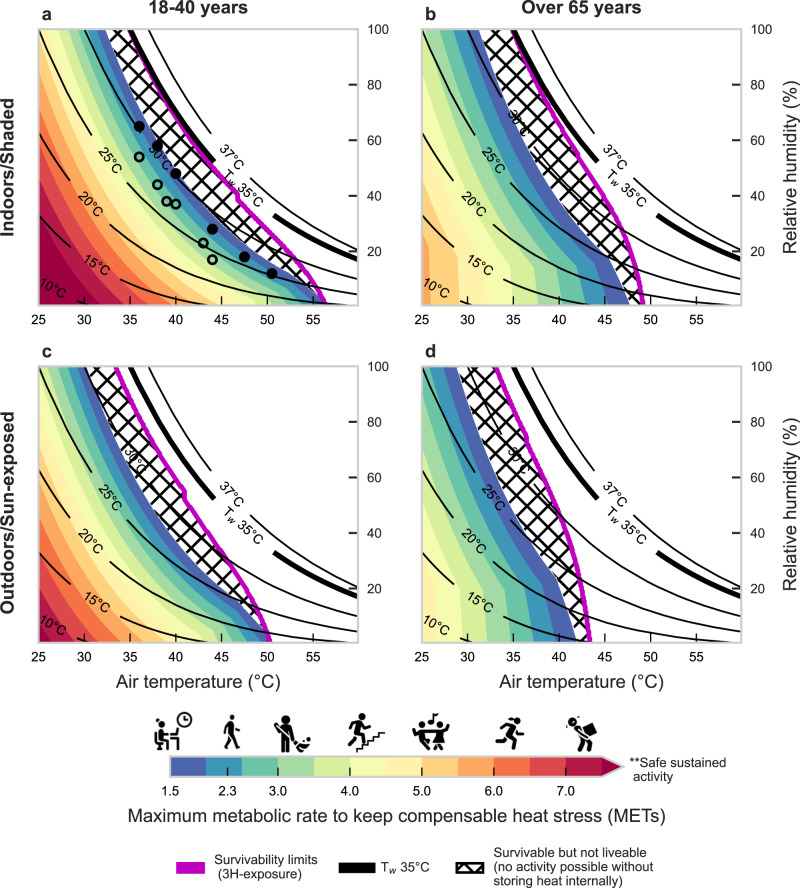
Fig. 4. Estimates of liveability at varying combinations of air temperature and relative humidity.
Liveability estimates based on maximum safe metabolic rate () that a person can generate without a sustained positive rate of heat storage even with a maximal thermoregulatory response. Results are presented across a range of air temperature and relative humidity for younger (a, c) and older adults (b, d) in shaded (top) or sun-exposed (bottom) steady-state environments. The new 3-hour survivability line is shown in purple; constant Tw values are shown by the solid black lines until 37 °C to avoid unrealistic conditions, with Tw = 35 °C shown by the thick black line. Activities by MET level range from no activity (sitting ~1.5 METs), to housework (~3.0 METs), dancing (~5.0 METs), and heavy lifting (~7.0 METs). The hatched area indicates conditions that are survivable but not livable (i.e., people cannot increase their activity without continuously storing heat inside the body, which will lead to a continuous rise in core temperature, but heat stroke death after a 3-hour exposure would not occur). Icons indicate MET-equivalent activities according to Ainsworth et al.56. Circles indicate critical Tw limits reported by Wolf et al.62 for minimal (~1.8 METs–filled circles) and light physical activity (~3.2 METs–open circles). Note: 1 MET corresponds to complete rest. See Supplementary Figs. S6 and 7 for vapor pressure and specific humidity on y-axis, respectively. Icons provided by Icons8 (https://icons8.com). Source data are provided as a Source Data file.

