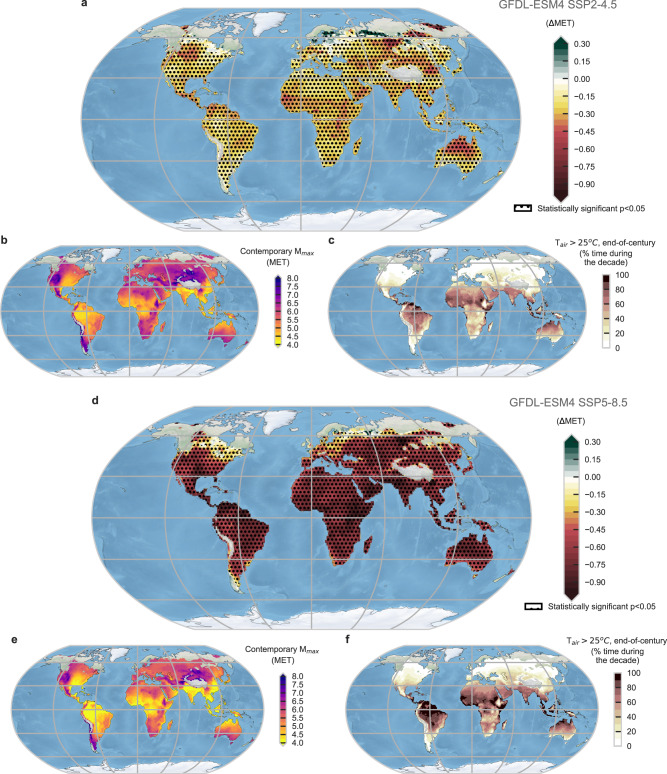
Fig. 6. Global maps of liveability estimates.
a, d Differences in median safe (maximum safe metabolic rate) (MET) between the present (2016–2026) and end-of-century (2091–2100) for SSP2-4.5 and SSP5-8.5, respectively (negative values indicate less activity possible), with dotted areas indicating locations where median difference is significantly different (P < 0.05), (b, e) Median for current decade (2016–2026) for SSP2-4.5 and SSP5-8.5, respectively, where lower values (e.g., in Bangladesh) indicate the most oppressive conditions and least ability to perform activity, (c, f) the percentage of time for 2091–2100 decade with Tair > 25 °C for SSP2-4.5 and SSP5-8.5, respectively. All analyses are based on warm conditions (Tair >25 °C) for young adults. 3-hourly CMIP6 data are from GFDL ESM4 (~1° 1.25° atmosphere/land grid) following SSP2-4.5. Areas with no data indicate locations that do not reach Tair > 25 °C in the given decade. Note: 1 MET corresponds to complete rest. CMIP6 Coupled Model Intercomparison Project phase 6, GFDL ESM4 Geophysical Fluid Dynamics Laboratory Earth Systems Model 4. SSP Shared socioeconomic pathway. Made with Natural Earth - free vector and raster map data at naturalearthdata.com. Source data are provided as a Source Data file.

