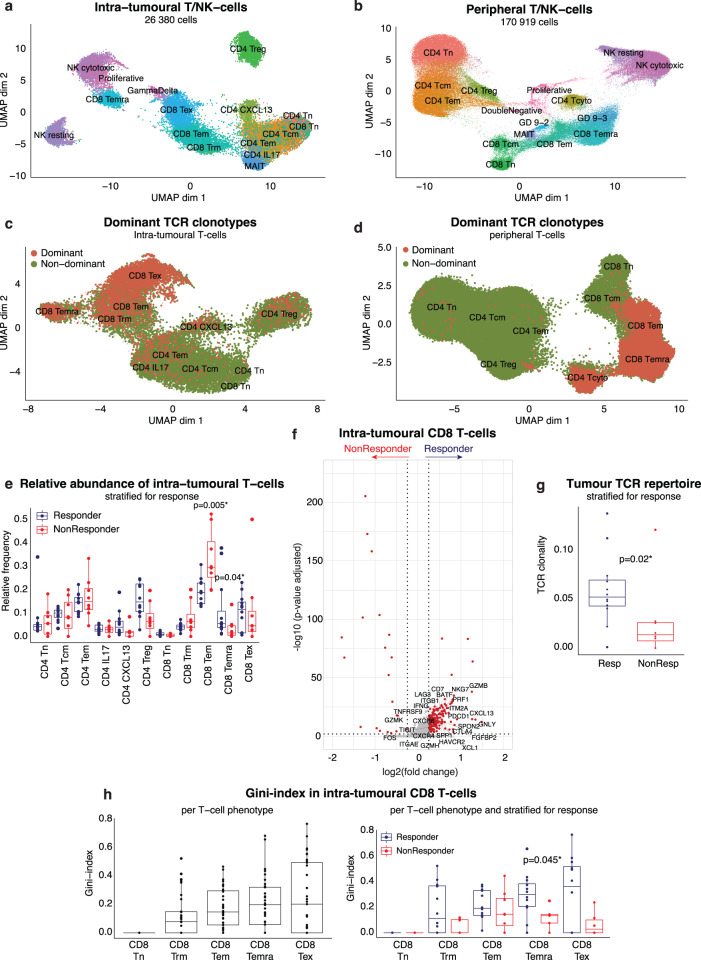
Fig. 2. Clonally-expanded CD8 TEMRA are associated with response to atezolizumab/bevacizumab.
a. UMAP representation depicting intra-tumoural T/NK-cell phenotypes (n = 38 tumour biopsies). b. UMAP representation of peripheral T/NK-cell phenotypes(n = 72 PBMC samples). c. UMAP representation of dominant versus non-dominant clonotypes in intra-tumoural T cells (n = 38 tumour biopsies). Dominant clonotypes were defined as TCR sequences shared by >5 T cells. d. UMAP representation of dominant versus non-dominant clonotypes in peripheral T cells (n = 72 PBMC samples). Dominant clonotypes were defined as TCR sequences shared by >5 T cells. e. Boxplots depicting relative abundance of intra-tumoural T-/NK-cell phenotypes in atezo/bev-treated patients (n = 20), calculated per patient and stratified for response (12 Resp versus 8 NonResp). P-values calculated using two-sided Mann-Whitney U-test, only p-values < 0.05 are shown. Boxes indicate median +/- interquartile range; whiskers show minima and maxima. f. Volcano plot depicting differentially expressed genes in intra-tumoural CD8 T cells (n = 4313) from responders (n = 12; 3425 CD8 T cells) versus non-responders (n = 8; 888 CD8 T cells). P-values were obtained using the two-sided Wilcoxon test and Bonferroni-corrected (Seurat 453). Red: adjusted p-value < 0.01 and log2 fold change >0.25. g. TCR clonality of intra-tumoural T cells in atezo/bev-treated patients (n = 20), calculated per patient and stratified for response (12 Resp versus 8 NonResp). P-value calculated using Mann-Whitney U-test. Boxes indicate median +/- interquartile range; whiskers show minima and maxima. h. Gini-index of intra-tumoural CD8 T cells. Left: calculated per patient (n = 37), per CD8 T cell phenotype. Right: in atezo/bev-treated patients (n = 20), calculated per patient and stratified for response (12 Resp versus 8 NonResp). P-values calculated using two-sided Mann-Whitney U-test, only p-values < 0.05 are shown. Boxes indicate median +/- interquartile range; whiskers show minima and maxima. (GD, γδ T cells; TCR, T cell receptor; UMAP, Uniform Manifold Approximation and Projection; Resp, responder; NonResp, non-responder).

