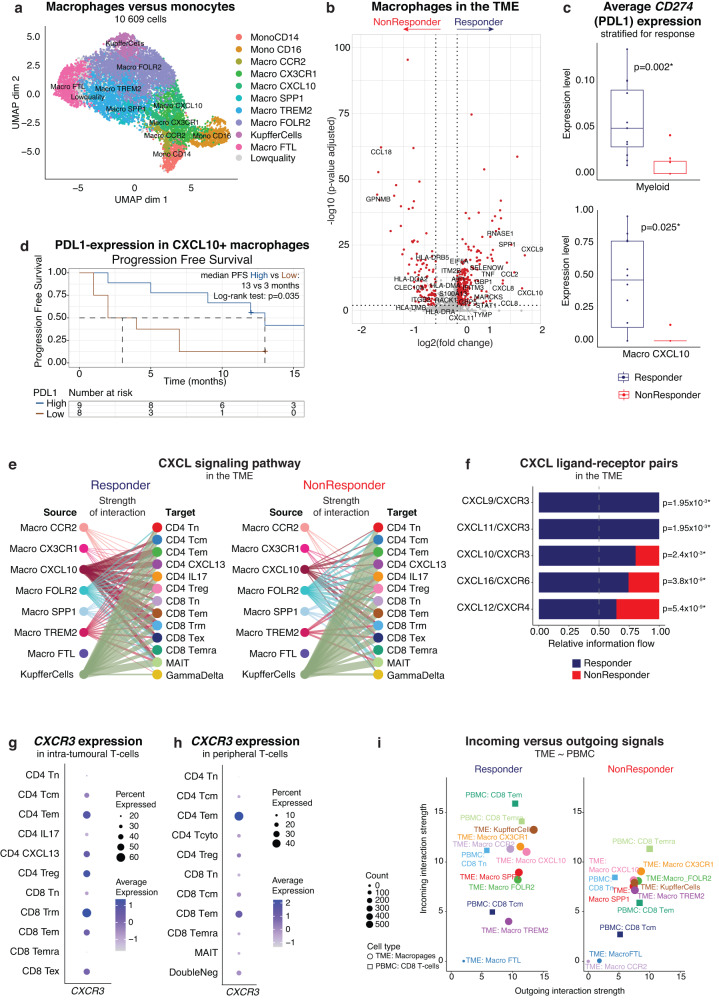
Fig. 5. Pro-inflammatory PDL1-expressing CXCL10+ macrophages recruit effector-memory T cells into the TME.
a. UMAP representation of monocyte and macrophage phenotypes in the TME. b. Volcano plot of differentially expressed genes in macrophages (n = 9233) in the TME of responders (n = 12) versus non-responders (n = 8). P-values were obtained using the two-sided Wilcoxon test and Bonferroni-corrected (Seurat 453). Red: adjusted p-value < 0.01 and log2 fold change >0.25. c. Boxplots depicting average CD274 (PDL1) expression level in the TME of atezo/bev-treated patients, calculated per patient in myeloid cells (top; n = 20; 12 Resp versus 8 NonResp) and CXCL10+ macrophages (Macro CXCL10, bottom; n = 17; 12 Resp versus 5 NonResp), stratified for response. P-values calculated using two-sided Mann-Whitney U-test. Boxes indicate median +/- interquartile range; whiskers show minima and maxima. d. Kaplan-Meier plot of progression free survival in atezo/bev-treated patients (n = 17) with high or low (split by median) PDL1-expression in CXCL10+ macrophages. e. Hierarchy plot of the CXCL signalling pathway in the TME, depicting cell-cell interactions between intra-tumoural macrophages (source) and intra-tumoural T cells (target cells) in responders (left) and non-responders (right). The width of edges represents the strength of communication. f. Bar plot depicting the overall information flow for each ligand-receptor pair of the CXCL signalling pathway in the TME of responders versus non-responders. Overall information flow is defined by the sum of the communication probability among all pairs of cell groups in the inferred network. P-value calculated using two-sided Wilcoxon test. g. Dot plot of CXCR3 expression in intra-tumoural T cells. h. Dot plot of CXCR3 expression in peripheral T cells. i. Scatterplot depicting the dominant senders (sources) and receivers (targets) between intra-tumoural macrophage phenotypes and peripheral CD8 T cells. X- and y-axis represent the total outgoing or incoming communication probability associated with each cell group. Symbol size is proportional to the number of inferred links (both outgoing and incoming) associated with each cell group. (PBMC, peripheral blood mononuclear cells; PDL1, Programmed death-ligand 1; TME, tumour-microenvironment; UMAP, Uniform Manifold Approximation and Projection).

