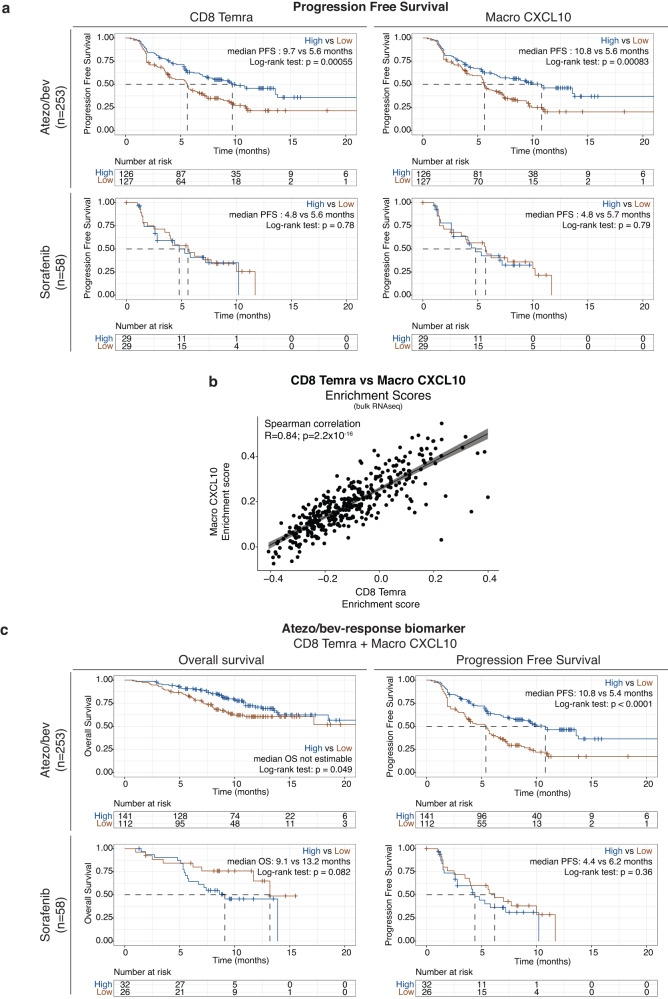
Fig. 7. CD8 TEMRA and Macro CXCL10 as predictive biomarkers of response to atezolizumab/bevacizumab.
a. Kaplan-Meier plots of progression free survival in 253 atezo/bev-treated (top) versus 58 sorafenib-treated advanced HCC patients (bottom) with high versus low (split by median) CD8 TEMRA (left) or Macro CXCL10 (right) enrichment score, calculated per sample in bulk RNA-sequencing data. P-values calculated using the log-rank test. Median progression free survival as indicated. b. Scatter plot depicting the correlation between CD8 TEMRA and Macro CXCL10 enrichment scores, calculated per sample in bulk RNA-sequencing data of 311 advanced HCC patients. P values calculated using two-sided Spearman’s rank correlation test. R-values are Spearman’s rank correlation coefficients (rho). Error bands represent the 95% confidence interval. c. Kaplan-Meier plots of overall survival (left) and progression free survival (right) in 253 atezo/bev-treated (top) versus 58 sorafenib-treated advanced HCC patients (bottom) with high versus low atezo/bev-response biomarker enrichment score (using optimal cut-off determined by maximally selected rank statistics, see Methods for details), calculated per sample in bulk RNA-sequencing data. (Atezo/bev, atezolizumab plus bevacizumab; PFS, Progression free survival).

