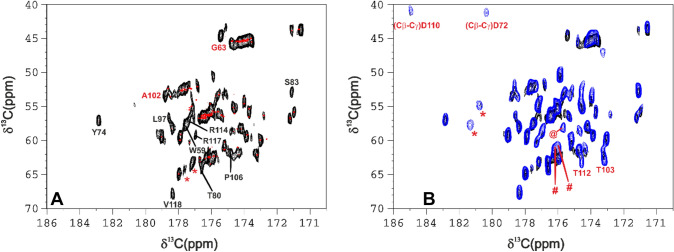
Fig. 2.
175 MHz, 298 K NMR spectra of reduced CISD3. A HCACO spectra obtained using the sequence reported in Fig. 1A. The spectrum shown in red (standard dataset) has been obtained with the following parameters: acquisition (t2max) and recycle delays 92 ms and 1 s; δ = 1.8 ms, δ’ = 1.1 ms, ∆ = 4.5 ms, T = 14.2 ms. 32 scans each FID were recorded over a 1024 × 660 data point matrix. Total experimental time was 6.5 h. The spectrum shown in black (paramagnetic tailored dataset) has been obtained with acquisition (t2max) and recycle delays 46 ms and 400 ms; δ = 1.4 ms, δ’ = 1.1 ms, T = ∆ = 2.7 ms. 1024 scans each FID were recorded over a 512 × 50 data point matrix. Total experimental time was 6.5 h. Assignment reported in black shows residues that could be sequence specifically assigned with a set of paramagnetic tailored experiments60, labels in red indicate peaks that were identified, and some of them assigned, in this experiment. B HCACO (black) vs CACO-AP (blue). The spectrum shown in black is the same reported in panel A, the spectrum shown in blue has been obtained with the pulse sequence reported in Fig. 1B, with acquisition (t2max) and recycle delays 24.5 ms and 300 ms. The Cα-to-C’ INEPT period was set to ∆ = 2.7 ms. 1024 scans each FID were recorded over a 512 × 70 data point matrix. Total experimental time was 6.5 h. Labels show peaks that were observed only in the CACO-AP and discussed throughout the text

