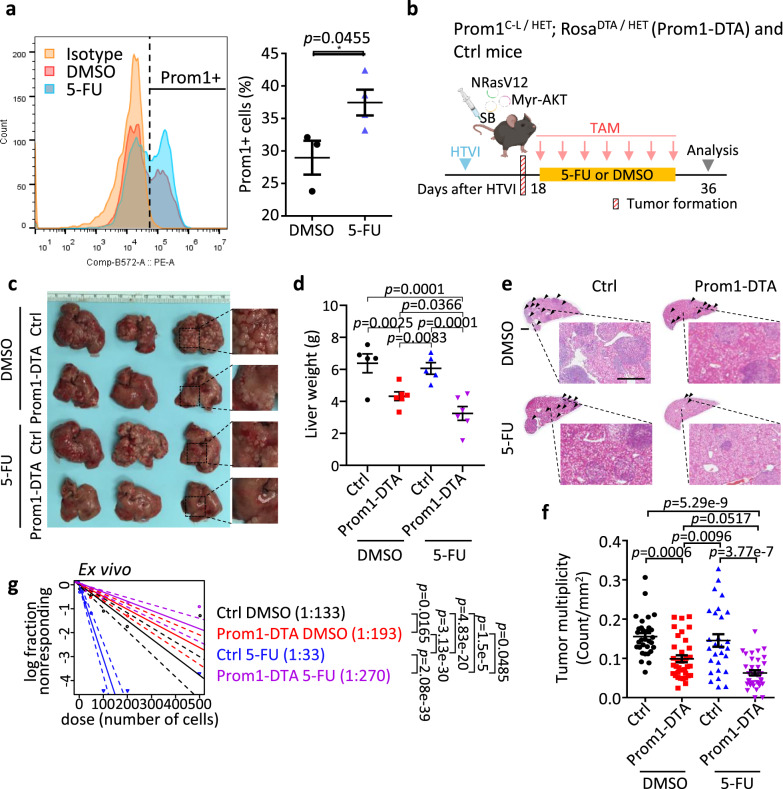
Fig. 1. 5-fluorouracil (5-FU) chemotherapy in vivo enrich for a CD133/Prom1+ liver tumor-initiating/propagating cell subset in HCC.
a Flow cytometry analysis for Prom1 expression in mouse NRasV12+Myr-AKT HTVI HCC tumors with DMSO or 5-FU treatment. Isotype-stained cells were used as negative control. b Experimental scheme of Prom1+ cells depletion in combination with 5-FU treatment in NRasV12+Myr-AKT HTVI HCC model. Selective depletion of Prom1+ tumor-initiating/propagating cells were achieved by using conditional CreER-induced DTA expression and selective cell death (Prom1-DTA). After tumor initiation, Prom1-DTA and control (Ctrl) mice were treated with 4 mg tamoxifen (TAM), and 5-FU (i.p., 20 mg/kg) or DMSO every other day for two weeks. Liver tissues were collected one week after the last dose of drug treatment. c Representative image and d quantitative data of liver weights from Ctrl or Prom1-DTA mice treated with DMSO or 5-FU. e Representative H&E staining and f quantitative data of tumor multiplicity (number of tumor nodules per section) from Ctrl and Prom1-DTA mice after DMSO or 5-FU treatment. Tumors indicated by arrowheads. Scale bar = 1 mm. g Ex vivo limiting dilution analysis for frequency of tumor-initiating cells (TICs) in cells harvested from Ctrl and Prom1-DTA mice with DMSO or 5-FU treatments. a n = 3 mice for DMSO group, 4 mice for 5-FU group; (b-g) n = 5 mice for Ctrl DMSO and Ctrl 5-FU groups, 6 mice for Prom1-DTA DMSO and Prom1-DTA 5-FU groups; f n = 31 views of H&E staining for Ctrl DMSO groups, 35 views of H&E staining for Prom1-DTA DMSO groups, 28 views of H&E staining for Ctrl 5-FU groups, 36 views of H&E staining for Prom1-DTA 5-FU groups; g 18–40 replicates in 3 independent experiments. Data were expressed as mean ± s.e.m. Statistical analysis: a two-sided Unpaired Student’s t-test, d, f two-way ANOVA, or g one-sided Person’s χ2 test with 95% confidence intervals. Source data are provided as a Source Data file. An illustration for b was created using BioRender.com.

