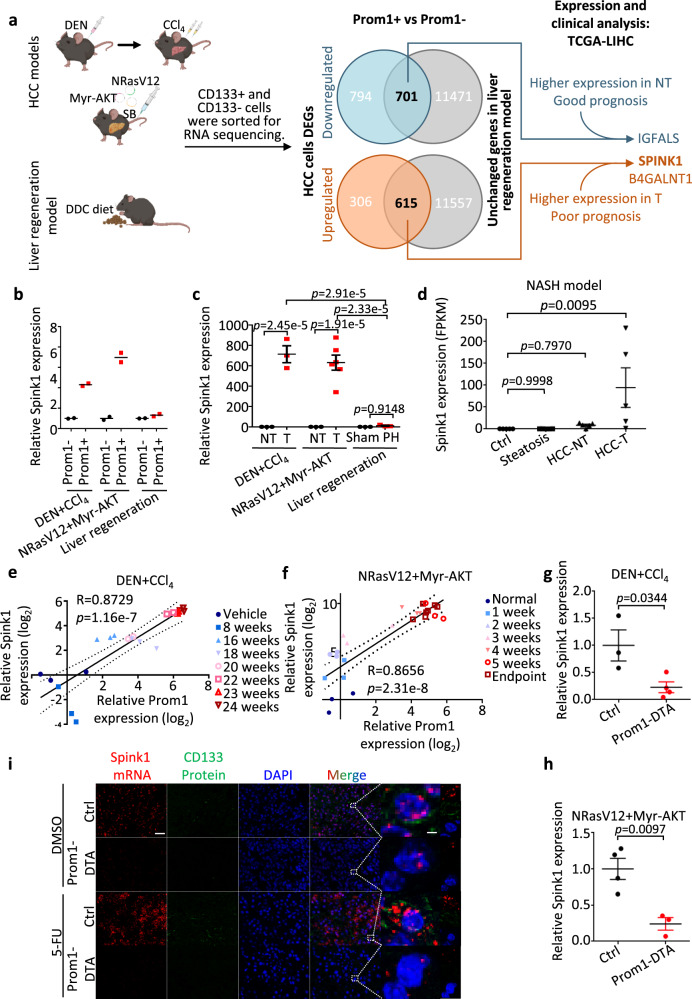
Fig. 2. Preferential upregulation of Spink1 in CD133/Prom1+ tumor-initiating/propagating cells and HCC tumors in mouse models.
a Experimental scheme: differential expressed genes (DEGs) analysis in Prom1+ tumor-initiating/propagating cells using two HCC mouse models (DEN+CCl4-induced fibrosis-related HCC and NRasV12+Myr-AKT HTVI) and one liver regeneration model (0.1% DDC diet). Transcriptome sequencing identified Prom1+ cells-specific DEGs in HCC tumors, but not in regenerating liver. TCGA-LIHC cohort used for expression and clinical survival analysis to narrow down potential candidate genes. See Supplementary Fig. S2A for detailed data analysis pipelines. SB = Sleeping beauty b qPCR validation for Spink1 expression in the CD133+ and CD133- subpopulations in the three mouse models. c qPCR analysis for Spink1 expression in non-tumor (NT) and tumor tissues (T) of the two HCC mouse models, and in sham or regenerating livers of 70% partial hepatectomy (PH) mouse model. d RNA-seq analysis for Spink1 mRNA expression in various tissues of nonalcoholic steatohepatitis (NASH) mouse model. e, f Pearson correlation analysis of Spink1 and Prom1 expression in two HCC models, from normal to advanced HCC (●, ■, ▲, ▼, ○, □, △, ▽). g, h qPCR analysis for Spink1 expression in Ctrl and Prom1-DTA mice of the two mouse models. i Representative liver tissue images from Ctrl or Prom1-DTA mice of NRasV12+Myr-AKT mouse model treated with DMSO or 5-FU, showing Spink1 (red) and CD133 (green). DAPI (blue), nucleus. Scale bar in low magnification = 30 μm; high magnification = 2 μm. b n = 2 mice; c n = 3 mice (T and NT) of DEN+CCl4 model and liver regeneration model, n = 3 mice (NT), 6 mice (T) of NRasV12+Myr AKT model; d n = 5 mice; e, f n = 2–7 mice, g, h n = 3 mice (Ctrl), 4 mice (Prom1-DTA) of DEN+CCl4 HCC model, n = 4 mice (Ctrl), 3 mice (Prom1-DTA) of NRasV12+Myr AKT HCC model. Data were expressed as mean ± s.e.m. Statistical analysis: b, c two-way ANOVA, d one-way ANOVA, e, f two-sided Pearson correlation analysis, or g, h two-sided Unpaired Student’s t-test. Source data are provided as a Source Data file. Illustration for a was created using BioRender.com.

