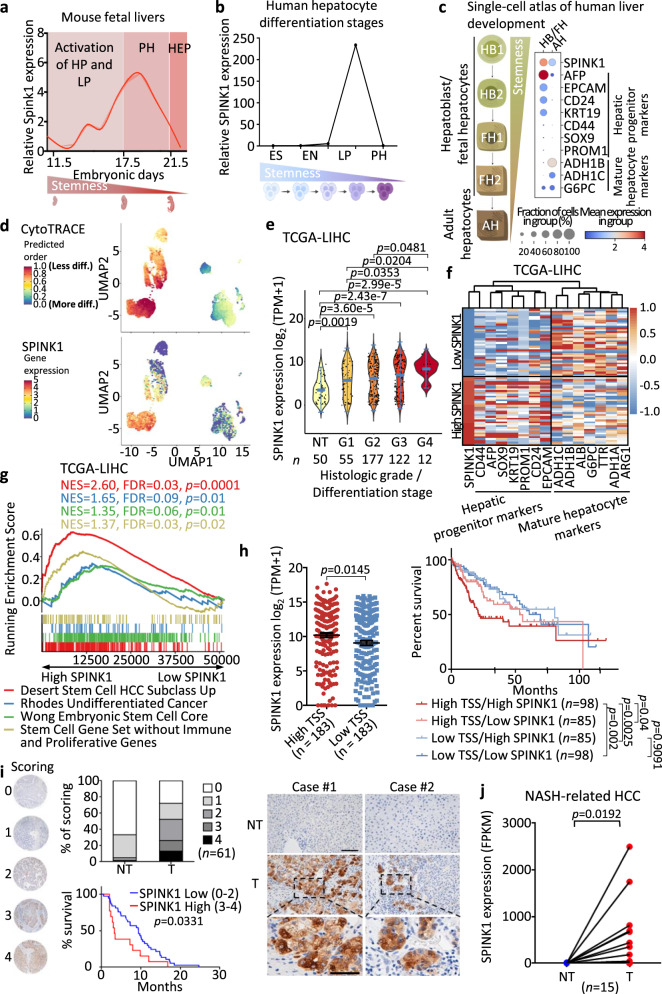
Fig. 3. High expression of Spink1/SPINK1 induces HCC tumor-lineage plasticity and is correlated with poor prognosis.
a, b qPCR analysis of Spink1/SPINK1 expression a in fetal mouse livers and b from human hepatocyte differentiation model at different developmental stages. ES Embryonic stem cell, EN Endoderm, HP Hepatic progenitor cell, LP Liver progenitor cell, PH Premature hepatocytes, HEP Mature hepatocytes. c, d Analysis of a human liver development single-cell atlas26 showed c SPINK1, hepatic progenitor and mature hepatocyte markers expression in HB/FH and AH clusters. Dot size = gene expression frequency; color intensity = expression level, and d UMAP of (top) CytoTRACE predicted order (more to less differentiated) and (bottom) SPINK1 expression (low to high), indicated by color from blue to red. e SPINK1 expression in TCGA-LIHC cohort, stratified by histological grading (Edmondson-Steiner 4-tier). NT non-tumor, G1 well differentiated, G2 moderately differentiated, G3 poorly differentiated, G4 undifferentiated. f–g Patients in TCGA-LIHC cohort were ranked based on SPINK1 expression. High SPINK1 = top 10% SPINK1; low SPINK1 = bottom 10% SPINK1. f Heatmap showing the clustering of SPINK1 expression with hepatic progenitor and mature hepatocyte markers. g SPINK1 high tumors showed enrichment of stem cell-related gene sets28,29 and undifferentiated cancer, via Gene Set Enrichment Analysis (GSEA). NES = Normalized enrichment scores; FDR = False discovery rate. h (Left) TCGA-LIHC dataset analysis of SPINK1 expression with high and low transcriptomic stemness score (TSS). (Right) Kaplan-Meier curve showing the overall survival in different TSS/SPINK1 groups. i (Left) SPINK1 protein expression in paired T and NT HCC clinical biopsies were examined by immunohistochemistry and expression intensities were scored. Kaplan-Meier analysis of the overall survival in patients with high and low SPINK1 scoring in their tumors. (Right) Representative SPINK1 staining images in paired T and NT samples of two HCC patients. Scale bar in low magnification = 100 μm; high magnification = 50 μm. j SPINK1 transcriptomic level in paired T and NT of NASH-related HCCs. a 2 replicates; b n = 1 experiment; j n = 15 paired T and NT samples. Data were expressed as mean ± s.e.m. Statistical analysis: g Kolmogorov–Smirnov test, h two-sided Unpaired Student’s t-test, h, i log-rank test, or j two-sided Paired Student’s t-test. e Data was expressed as a range (min to max), median as the centre, and distribution shape was shown. Statistical analysis: one-way ANOVA. Source data are provided as a Source Data file.

