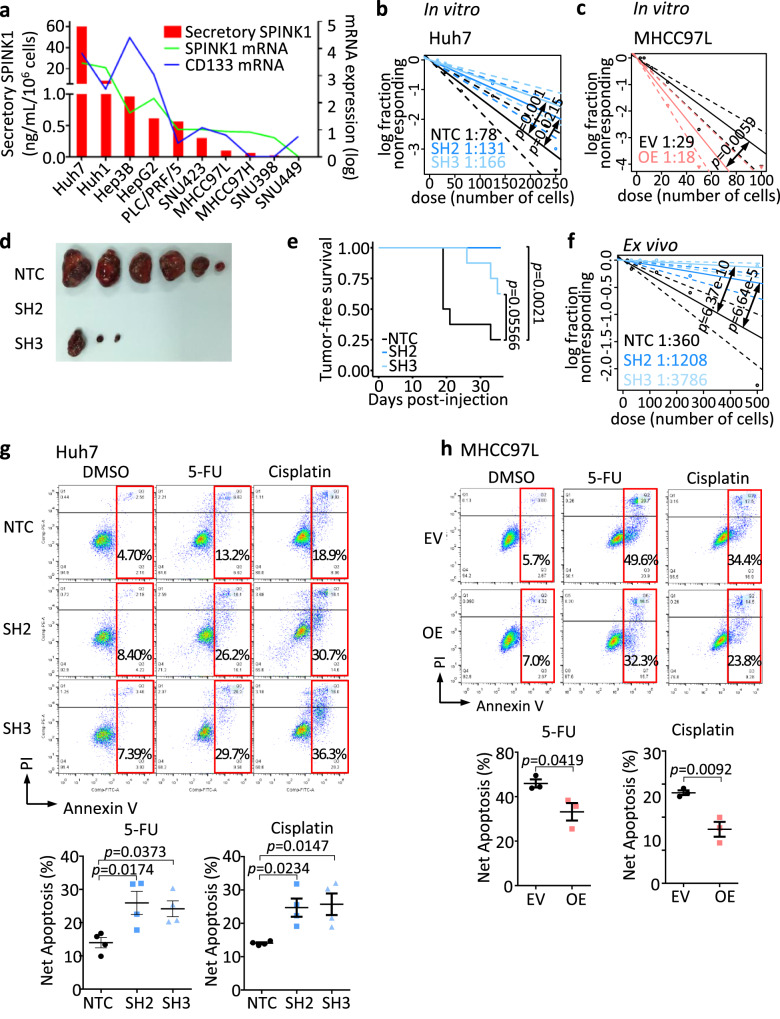
Fig. 4. SPINK1 promotes self-renewal and chemoresistance in HCC cells.
a SPINK1 and CD133 expression in a human HCC cell line panel. Red bars indicate secretory SPINK1 measured by ELISA. Lines indicate log transformed mRNA expression levels. b, c In vitro limiting dilution assays for evaluating self-renewal abilities in MHCC97L and Huh7 cells with or without SPINK1 expression manipulated. d, e In vivo limiting dilution assays, in serial passage, for evaluating tumor-initiating cells (TICs) frequency of Huh7 cells with either NTC, SH2, or SH3. d Tumor incidence, average latency, and estimated tumor-initiating frequency data. d Representative image of tumors formed by 50,000 Huh7 cells transplanted in NOD-SCID mice. e Kaplan–Meier curves showing the percentage of tumor-free survival of NOD-SCID mice transplanted with 50,000 Huh7 cells. f Ex vivo limiting dilution assay of tumors harvested from the primary implantation. g, h Cell apoptosis upon 5-FU or cisplatin treatment as demonstrated by Annexin V-PI flow cytometry analysis, in g Huh7 cells or h MHCC97L cells with or without SPINK1 gene manipulated. NTC = Non-target scrambled control; SH2 and SH3 = shRNA clones targeted for SPINK1 knockdown; EV = Empty vector control; OE = SPINK1 overexpression. a 2 replicates, n = 1; b, c 20 replicates in 3 independent experiments; d, e n = 4 mice for primary implantation, 7 mice for secondary implantation; f 20 replicates; g n = 4 independent experiments; h n = 3 independent experiments. Data were expressed as mean ± s.e.m. Statistical analysis: b, c, f one-sided Person’s χ2 test with 95% confidence intervals, e log-rank test, or g one-way ANOVA, or h two-sided Unpaired Student’s t-test. Source data are provided as a Source Data file.

