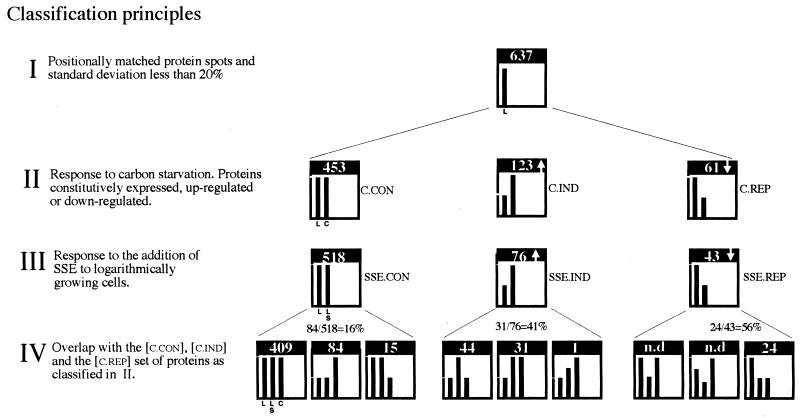
FIG. 2.
Classification and enumeration of proteins based on change in the relative synthesis rate in response to carbon starvation (II) and to the addition of SSE during logarithmic growth (III) and overlap with carbon starvation-induced proteins (IV). The difference in the heights of the bars in each graph represents the relative difference in the relative synthesis rate (±20%) for the number of proteins that are indicated in each graph. The twofold difference in the heights of the bars indicates the minimum change considered significant. Bars are labeled in the first histogram of each row, and the labels are applicable to the other histograms in the same row. Conditions compared: logarithmic growth (L), addition of SSE at 50 μg ml−1 during logarithmic growth (LS), and 1 h of carbon starvation (C).

