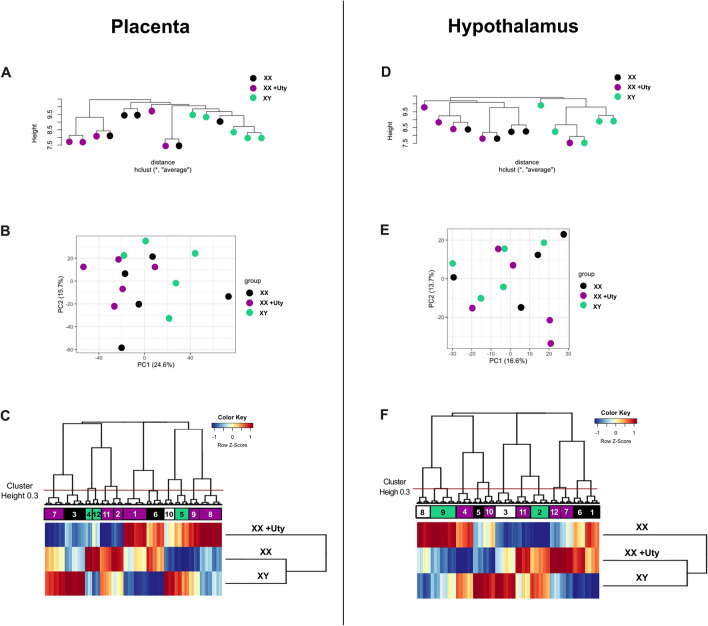
Figure 2.
Global changes in gene expression were not observed with random insertion of Uty-Tg in XX females. (A) Cluster dendrogram and (B) principal component analysis (PCA) plots of gene expression data demonstrate the distribution of XY, XX, and XX + Uty placenta (n = 5). (C) Heatmap depicting all detectable transcripts in the placenta (14,230). Unbiased hierarchical clustering was used to group genes into distinct clusters and identify gene sets that were similar in directionality of their expression profiles between XX + Uty and XX (black), XX + Uty and XY (green, masculinized), differential expression unique to XX + Uty (purple), or expression profiles that did not show a unique or overlapping pattern between the groups (white). (D) The same approach and figures as above are also provided for all detectable transcripts in the hypothalamus cluster dendrogram, (E) PCA plot, and (C) heatmap of gene expression data demonstrating the distribution of XY, XX, and XX + Uty hypothalamic patterns (n = 4–5).

