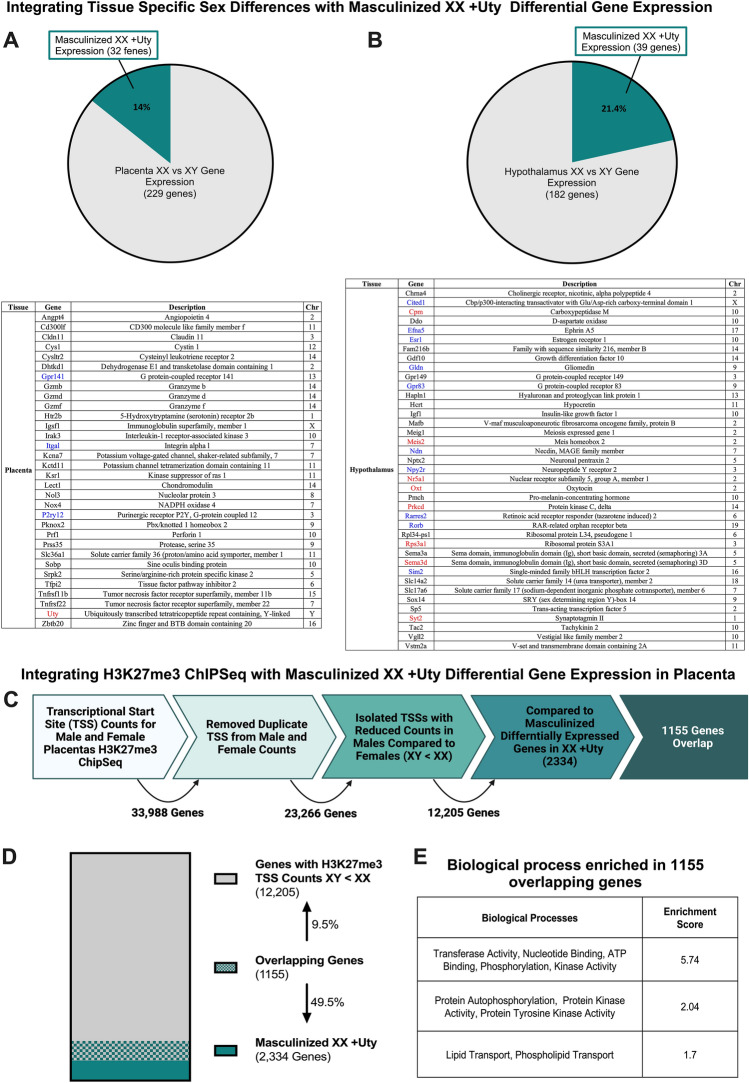
Figure 4.
Masculinized XX + Uty genes are shared between tissues, with established sex differences, and with genes that have male specific H3K27me3 profiles. Pie charts depicting overlap in masculinized XX + Uty and previously identified and published sex differences in the (A) placenta (n = 5) and (B) hypothalamus (n = 4–5)32,51. Gene names, descriptions, and chromosomes on which they are located are detailed in the inserted table, with genes that were similarly upregulated (red) or downregulated (blue) indicated by the colored text. (C) Schematic describing how previously published H3K27me3 ChIP-Seq data from male placentas was used and compared to genes that were masculinized in the XX + Uty gene set32. (D) Parts of a whole bar plot depicting the proportion of genes with TSS counts XY < XX (gray, 12,205 genes) and masculinized XX + Uty genes (green, 2334) that overlap (gray and green patterned, 1155 genes). Overlapping genes represent 9.5% of the genes identified in the male H3K27me3 ChIP-Seq and 49.5% of the XX + Uty masculinized dataset. (E) Biological processes enriched in the 1155 overlapping genes, identified by DAVID functional annotations.

