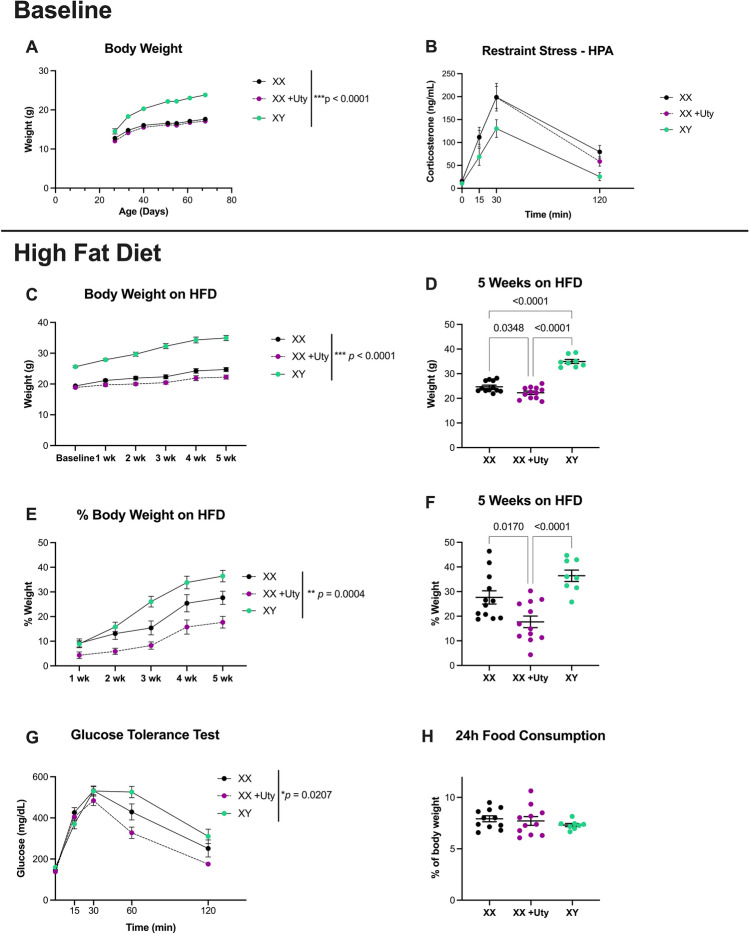
Figure 5.
XX + Uty animals gain less weight and have a higher glucose tolerance when challenged with a high fat diet compared to XX and XY mice. (A) Body weights were collected weekly from PN28–70. A significant effect of genotype was observed for baseline body weight measurements (F (2,29) = 63.4, p = 0.0001; η2 = 0.81), with XY being consistently heavier than XX + Uty (PN28, p = 0.02; PN35–PN70, p ≤ 0.0001; d = 1.98) and XX (PN35, p = 0.0002; PN42–70, p ≤ 0.0001; d = 1.81). There was no significant effect of Uty-Tg on XX + Uty bodyweight (n = 8–12). (B) Regulation of corticosterone levels time course was assessed following a 15-min restraint stress with sampling at 0, 15, 30, and 120 min. No significant effect of Uty-Tg was observed on XX hypothalamic–pituitary–adrenal-axis (HPA) response (n = 7–13). Following baseline assessments, mice were challenged with a high fat diet (HFD) for 5 weeks. Body weights were collected weekly while on the diet. (C) A significant effect of genotype was observed throughout the 5-week dietary challenge (F (2,29 = 85.08, p = 0.0001; η2 = 0.85), where XY mice were heavier than XX + Uty (Wk1–5, p ≤ 0.0001; d = 3.70) and XX mice (Wk1–5, p ≤ 0.0001; d = 2.86). (D) At the end of the 5-week HFD challenge, there was still a significant effect of genotype (F(2,29) = 79.50, p = 0.0001; η2 = 0.85, with XX mice weighing less than XY mice (p ≤ 0.0001; d = 4.52) and XX + Uty weighing less than XY and XX mice (p ≤ 0.0001; d = 5.50 and p = 0.03; d = 1.08). (E) A significant effect of genotype was observed for percent weight gained on HFD over the 5-week period (F (2,29) = 10.45, p = 0.0004; η2 = 0.42), with XX + Uty consistently having a lower percent weight gain than XY mice (Wk2, p = 0.01; Wk3, p = 0.0002; Wk4, p = 0.003; Wk5, p = 0.0004; d = 1.50). (F) This significant effect of genotype persisted to the end of the five-wk dietary challenge (F (2,29) = 12.65, p = 0.0001; η2 = 0.47), where XX + Uty mice had a significantly lower percent weight change than XY and XX mice (p = 0.02; d = 2.54; p ≤ 0.0001; d = 1.14). (G) Glucose tolerance test (GTT) was performed at 0, 15-, 30-, 60-, and 120-min. Genotype had a significant effect on glucose tolerance (F (2,31) = 4.407, p = 0.02; η2 = 0.22), with XX + Uty mice having significantly lower glucose levels at 60 and 120 min compared to XY mice (p = 0.0002; p ≤ 0.0001; d = 0.48). (H) Food consumption per cage (n = 4–5 cages with 2 mice/cage) was measured by weighing food at 0 and 24 h, and showed a significant effect of genotype (F(2,11) = 11.87, p = 0.0018; η2 = 0.68) with XY males consuming significantly more food compared to XX and XX + Uty females (p = 0.02; d = 2.08; p = 0.0014; d = 4.89).

