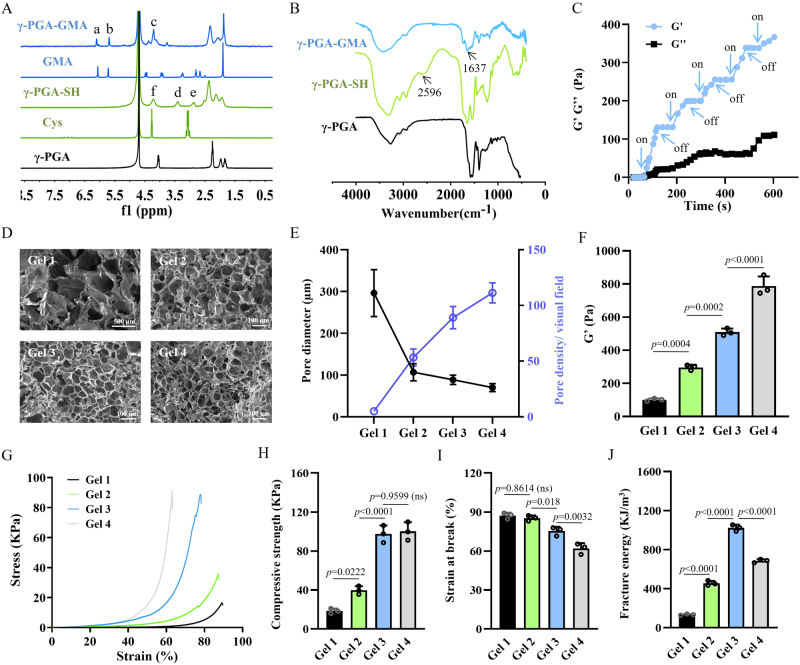
Fig. 2. Synthesis and optimization of the all-peptide hydrogels.
A 1H NMR spectrum of modified γ-PGA. a: δ = 6.27 ppm; b: δ = 5.64 ppm; c: δ = 4.13–4.52 ppm; d: δ = 3.36 ppm; e: δ = 2.87 ppm; f: δ = 4.13–4.52 ppm. B FTIR spectrum of modified γ-PGA. C Time-sweep rheological tests of the hydrogels with five cycles of blue light on and off. D Representative images of hydrogel micromorphology based on three repeated experiments with similar results. E Morphological analysis revealed the reduction in pore size and increase in pore density with increase in polymer concentration. n = 3 independent experiments. F Rheological results showing an increase in G′ of hydrogels when the polymer concentration is increased. n = 3 independent experiments. G Representative compressive stress-strain curves of different hydrogels. H Compressive strength of hydrogels with relatively high polymer concentration (Gel 3 and Gel 4) is increased compared to that of hydrogels with lower polymer concentration (Gel 1 and Gel 2). n = 3 independent experiments. I Strain at break of hydrogels is decreased with increase in polymer concentration. n = 3 independent experiments. J Fracture energy of Gel 3 is the highest among all the groups of hydrogels. n = 3 independent experiments. The p values in the figures (F, H–J) are determined by one-way ANOVA followed by Tukey’s multiple comparisons test. Data are presented as mean ± SD. ns not significant. Source data are provided as a Source Data file.

