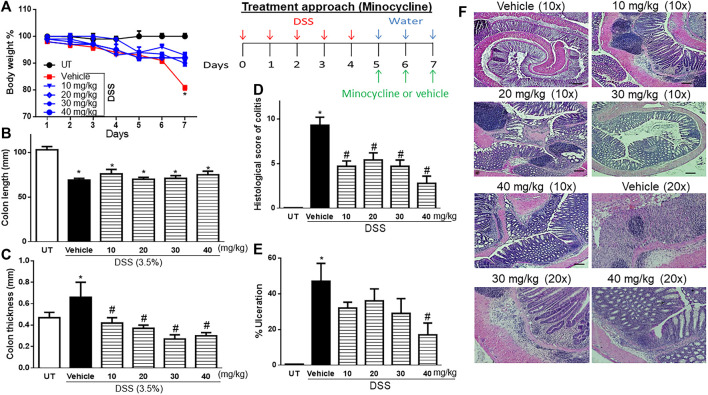
FIGURE 2.
Effect of therapeutic treatment with minocycline on colitis severity at the macroscopic and microscopic levels. (A) Percentage of body weight changes in DSS-treated mice receiving vehicle and minocycline-treated mice at various doses compared to untreated (UT) mice. Colon length (B), thickness (C), histological assessment of colitis severity (D), and the percentage of ulceration in the whole colon section (E) were determined in mice receiving DSS and either vehicle (solid bars) or various doses of minocycline (hatched bars) and in the UT healthy mice (open bars). Histobars represent means ± SEM for seven mice in each group. Asterisks denote a significant difference from UT mice with p < 0.05 (*), and # denotes a significant difference from DSS/vehicle-treated mice with p < 0.05. (F) Illustration of colon sections taken from various groups (×10 and ×20 magnifications; bars represent 150 μm).

