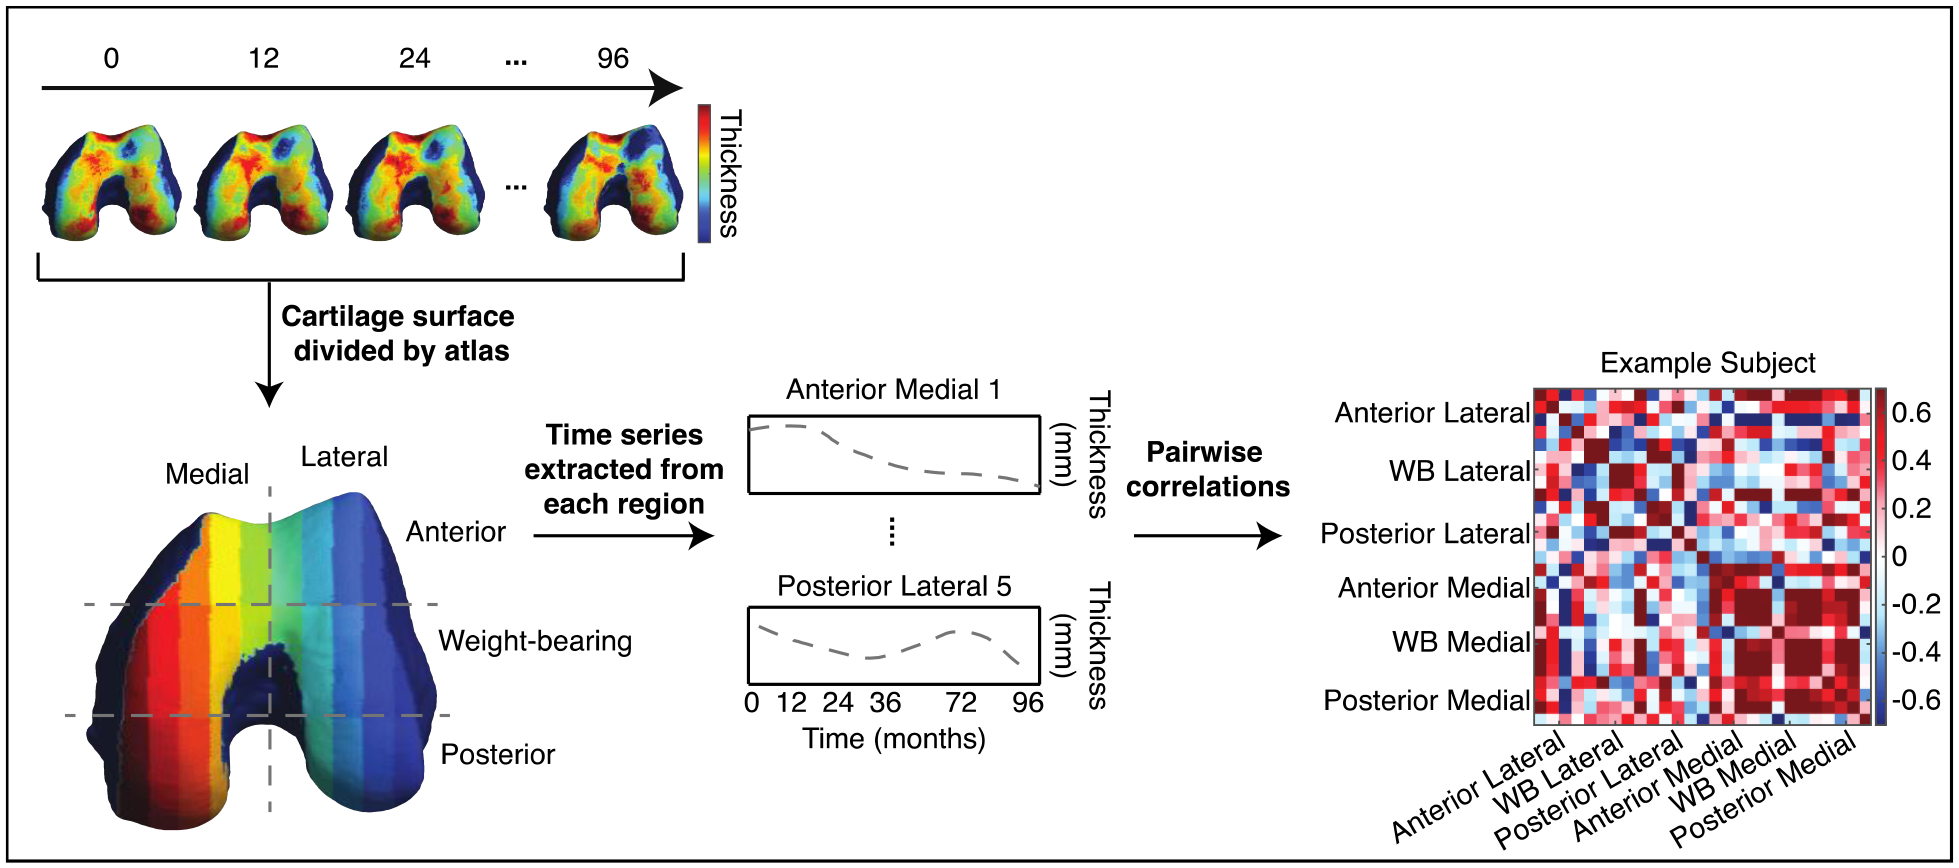
Figure 3: Schematic of connectome generation.

Cartilage thickness values at all vertices within each subregion of the cartilage atlas were averaged to obtain a single value per subregion. This was performed at all time points to obtain cartilage thickness trajectories for all subregions. Pearson correlation coefficient r was used to represent the similarity between each pairwise combination of time series, resulting in a symmetric correlation matrix (connectome) for each knee. Each row/column entry in the connectome represents the correlation between the thickness trajectories of a pair of the 27 subregions. Every labeled compartment in the connectome contains 4–5 subregions.
