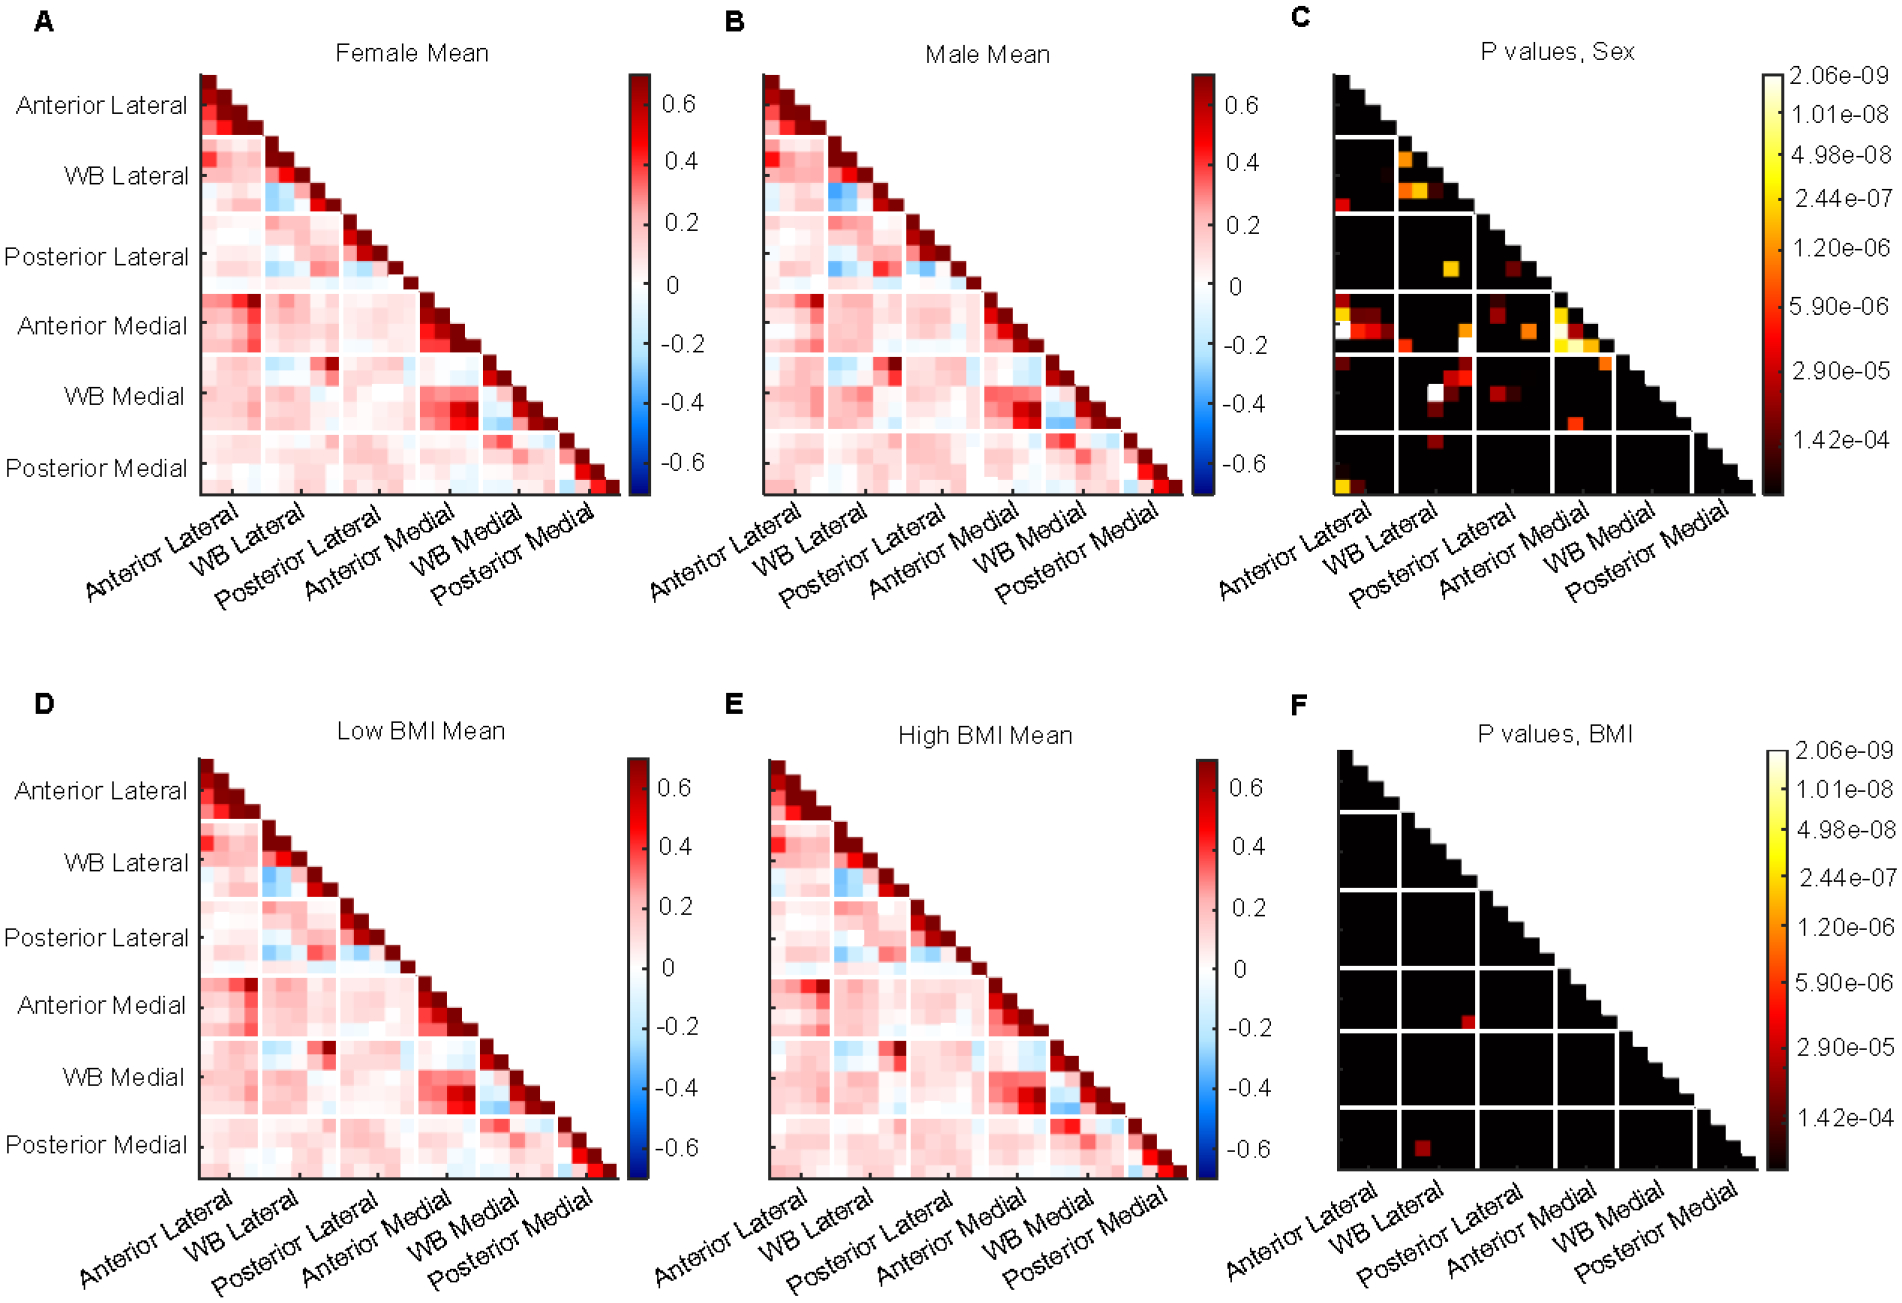
Figure 5: Population differences within control group.

A) Mean connectome for female subjects. B) Mean connectome for male subjects. C) P-value matrix comparing male and female mean connectomes. D) Mean connectome for subjects with a BMI below 30. E) Mean connectome for subjects with BMI ≥ 30. F) P-value matrix comparing mean connectomes for high and low BMI subjects.
