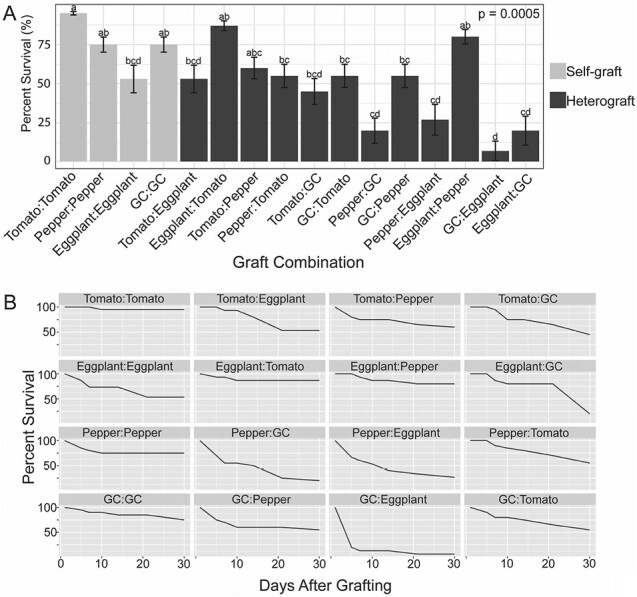
Fig. 4.

Survival rates for grafted plants 30 DAG. (A) Survival rates 30 DAG for all graft combinations. Light gray bars indicate self-graft combinations, and dark gray bars indicate heterograft combinations. GC=groundcherry. n=20 for all combinations except those containing eggplant, where n=15. Lower case letters above each bar indicate significant differences between the graft combinations based on pairwise comparisons using Fisher’s exact test, P<0.05. Error bars indicate the SE of proportion. (B) Survival rates over time for all graft combinations. Survival rates were calculated for each graft combination at 5, 7, 10, 14, 21, and 30 DAG. All graft combinations included at least 15 graft replicates; for a detailed description of bioreplication, see the Materials and methods.
