
Fig. 5.
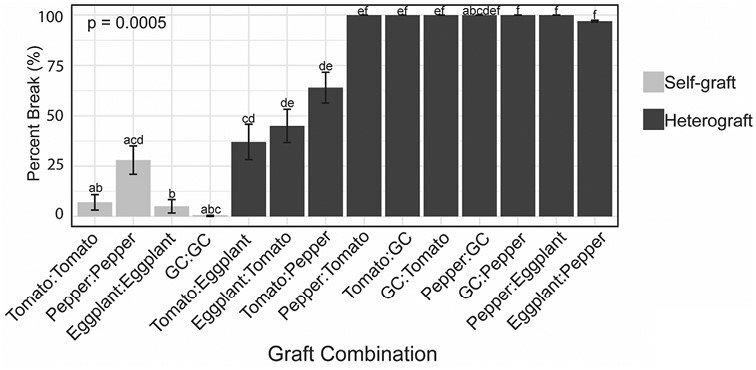
Tomato/eggplant heterografts exhibit strong graft compatibility based on the bend test. The percentage of plants that broke at the graft junction during the bend test. Light gray bars indicate self-grafted plants, and dark gray bars indicate heterografted plants. GC=groundcherry. GC:eggplant and eggplant:GC exhibited insufficient survival to conduct the bend test. Lower case letters above each bar indicate significant differences between graft combinations based on pairwise comparisons using Fisher’s exact test, P<0.05. Error bars indicate the SE of proportion. Replicate values dictated by survival of the graft combinations: T:T=42, P:P=29, E:E=40, GC:GC=12, T:E=19, E:T=20, T:P=14, P:T=7, T:GC=6, GC:T=6, P:GC=1, GC:P=15, P:E=18, E:P=38.