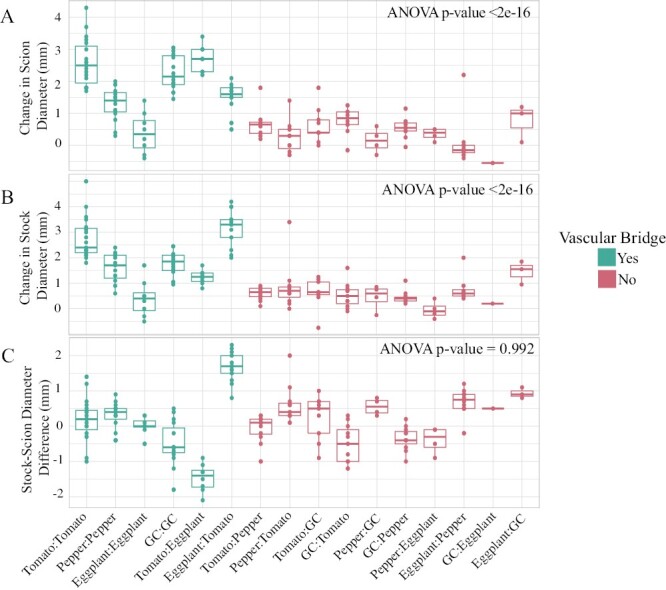
Fig. 7.

Stem growth is correlated with graft compatibility. (A) The change in scion diameter 30 DAG for all graft combinations. (B) The change in stock diameter 30 DAG for all graft combinations. (C) The difference between stock and scion diameter 30 DAG for all graft combinations. This differential growth was calculated by subtracting the scion diameter from the stock diameter of each graft combination 30 DAG. Teal indicates compatible grafts that formed successful vascular bridges (Fig. 6), and red indicates incompatible grafts that failed to form vascular reconnections. ANOVA was calculated between compatible and incompatible plants, P-value <0.05.
