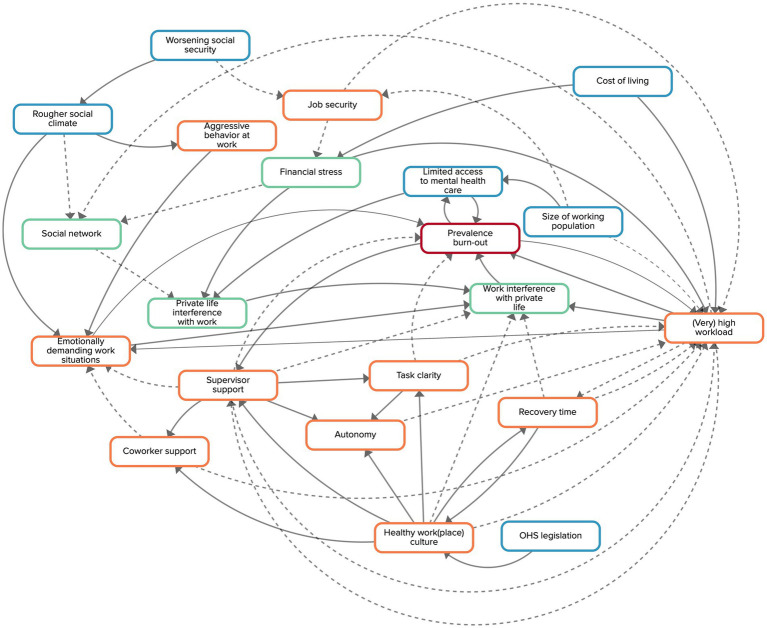
Figure 2.
Causal loop diagram made by the experts. Orange factors relate to working conditions, green factors to living conditions, and blue factors to societal developments. Factors are connected by arrows, indicating the direction of the relationship. Solid arrows indicate that both factors move in the same direction, dashed arrows indicate a counteracting relationship.

