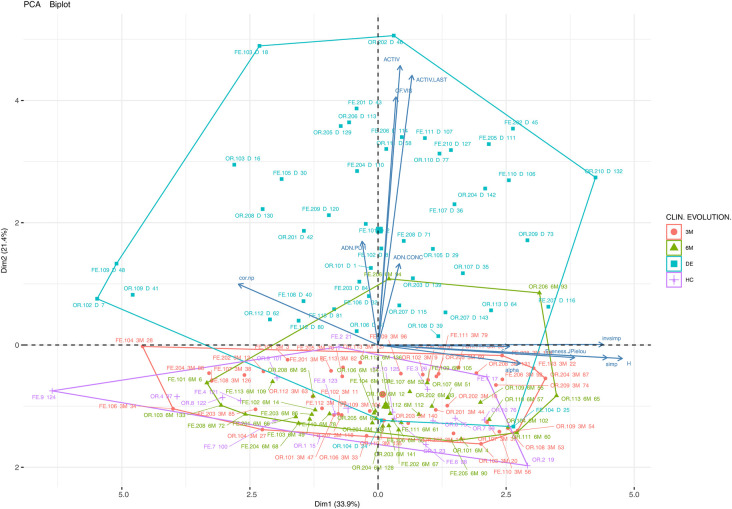
Figure 1.
Principal component analysis (PCA) biplot (variables and cases) of the clinical, biodiversity (richness, abundance, biodiversity indices) and other variables (DNA concentration, DNA purity) of all the samples and experimental groups of the study (CD, Crohn's disease; UC, ulcerative colitis; OR, oral samples; FE, faecal samples; HC, healthy control; DE, sampling points at disease onset/baseline; 3M, 3 months; 6M, 6 months). A point has been plotted for each of the 143 samples using sample type (FE, OR) and sample number (e.g., 102-DE, patient 102 at disease onset).

