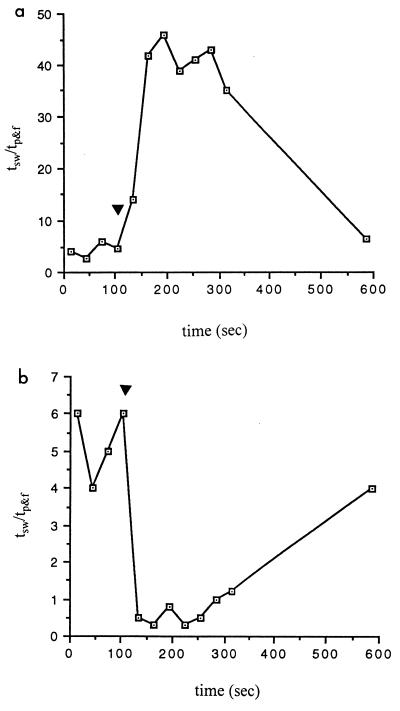
FIG. 1.
Cellular behavioral change in response to a chemoattractant (1% young rabbit serum; a) and a chemorepellent (100 mM ethanol; b). Wild-type B31 cells were used; the testing chemical was added to bacterial suspension at s 120, as indicated by an arrowhead. The behavioral change in response to the chemicals was studied by videomicroscopy, recorded by a VCR, and analyzed frame by frame for the ratio of time spent swimming and pausing-flexing (tsw/tp&f). Each data point represents a time ratio in a 30-s window. Data shown represent the behavioral change of one representative cell; more than 20 cells were studied, and similar results were observed.

