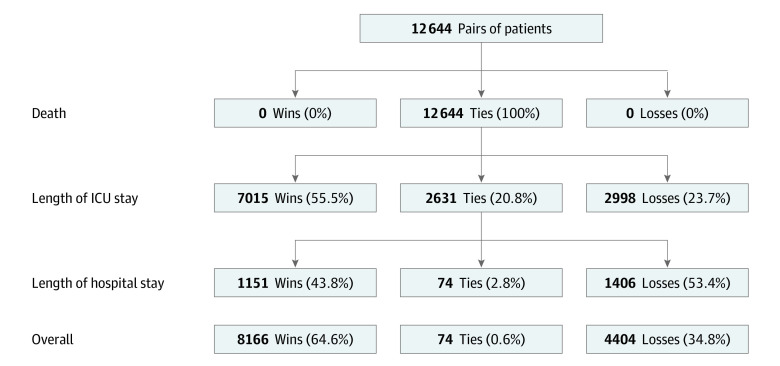
Figure 2. Distribution of Wins, Ties, and Losses for Patients.
The win ratio denotes the ratio of the proportion of wins to the proportion of losses. The figure shows the distribution of wins, ties, and losses for the 116 patients in the intervention group and 109 patients in the control group (12 644 pairs of patients). Win ratio = total wins/total losses = 8166/4404 = 1.85 (95% CI, 1.33-2.58). ICU indicates intensive care unit.

