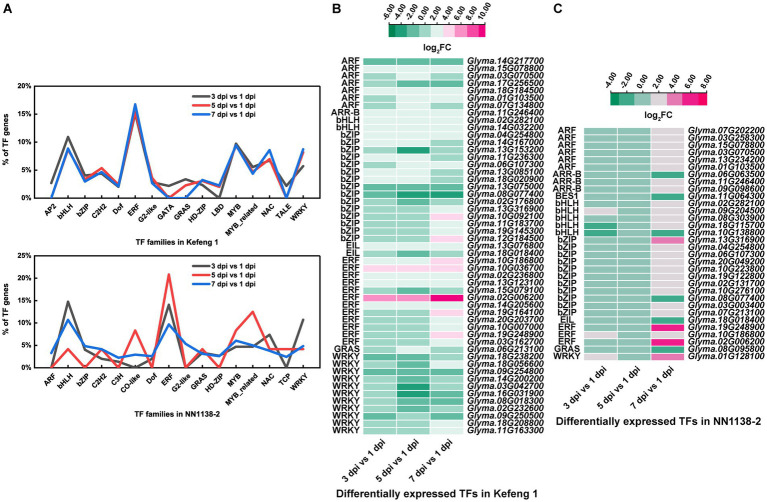
Figure 3.
Differentially expressed transcription factors (TFs) in two soybean cultivars. (A) The percentage of TFs among all DEGs in SMV-infected soybean seedlings at 3, 5, and 7 dpi coupled with 1 dpi. (B) Heatmap of differentially expressed TFs enriched in three KEGG pathways in ‘Kefeng 1’. (C) Heatmap of differentially expressed TFs enriched in three KEGG pathways in ‘NN1138-2’. The expression level was calculated using log2(FC). FC, fold change.

