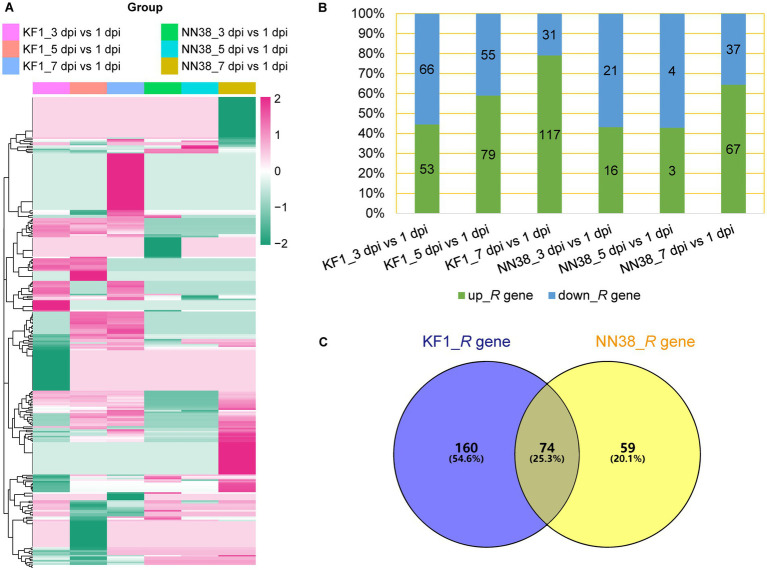
Figure 4.
Differential expression of putative R genes in two soybean cultivars. (A) Heatmap showing the expression profile of putative R genes upon SMV infection. (B) Number and percentage of up- and down-regulated R genes in each group. (C) Venn diagram showing individual and common differentially expressed R genes. KF1: ‘Kefeng 1’ (resistant line); NN38: ‘NN1138-2’ (susceptible line).

