Figure 6.
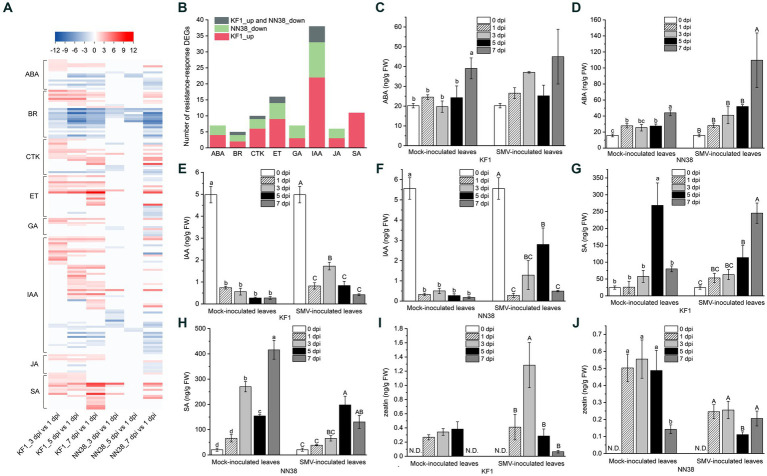
Expression analysis of phytohormone-related DEGs and quantitative analysis of four representative hormones in soybean leaves. (A) Heatmap analysis of phytohormone-related DEGs. (B) Number of resistance-response DEGs associated with each hormone. ABA (C,D), IAA (E,F), SA (G,H), and CTK (zeatin) (I,J) contents in uninfected (mock-inoculated) and infected (SMV-inoculated) leaves of Kefeng 1 (KF1) and NN1138-2 (NN38) plants. Values are the mean ± SE (standard error) of three biological replicates per treatment. Different letters above each column indicate a significant difference (upper and lower case letters suggest that the two sets of data were significantly analyzed independently; p < 0.05; n = 3). FW indicates fresh weight of soybean leaves and N.D. represents that zeatin content was not detectable in this sample.

