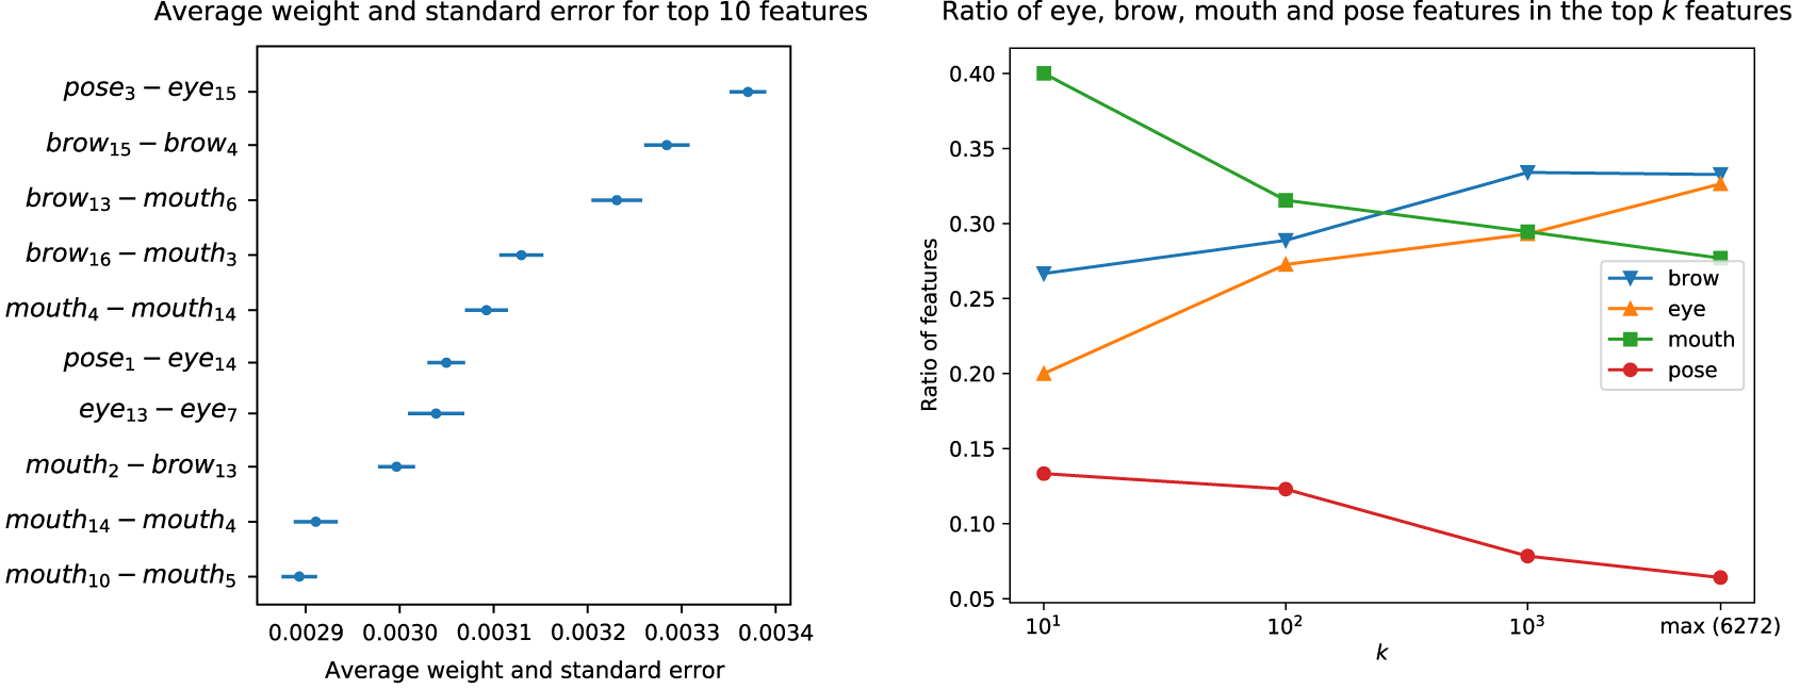
Figure 5:

(a) The labels and weights of the top 10 features along with the standard error (across cross-validation folds). (b) The ratio of each of the four feature categories (brow, eye, mouth, pose) in the top k features (i.e., k features with the highest average SVM weight) against k. The graphs are computed on the basis of a feature category appearing on either side of a correlation feature. For example, if a correlation feature is extracted from the correlation between a mouth and a pose feature, it is considered to be both a mouth and a pose feature. The rightmost value of each graph shows the baseline rate for each feature category –the ratio of the feature category in the entire set of 6272 features– highlighting the importance of the mouth and pose features, since they appear more frequently in the top-10, top-100, top-1000 features compared to their baseline rate.
