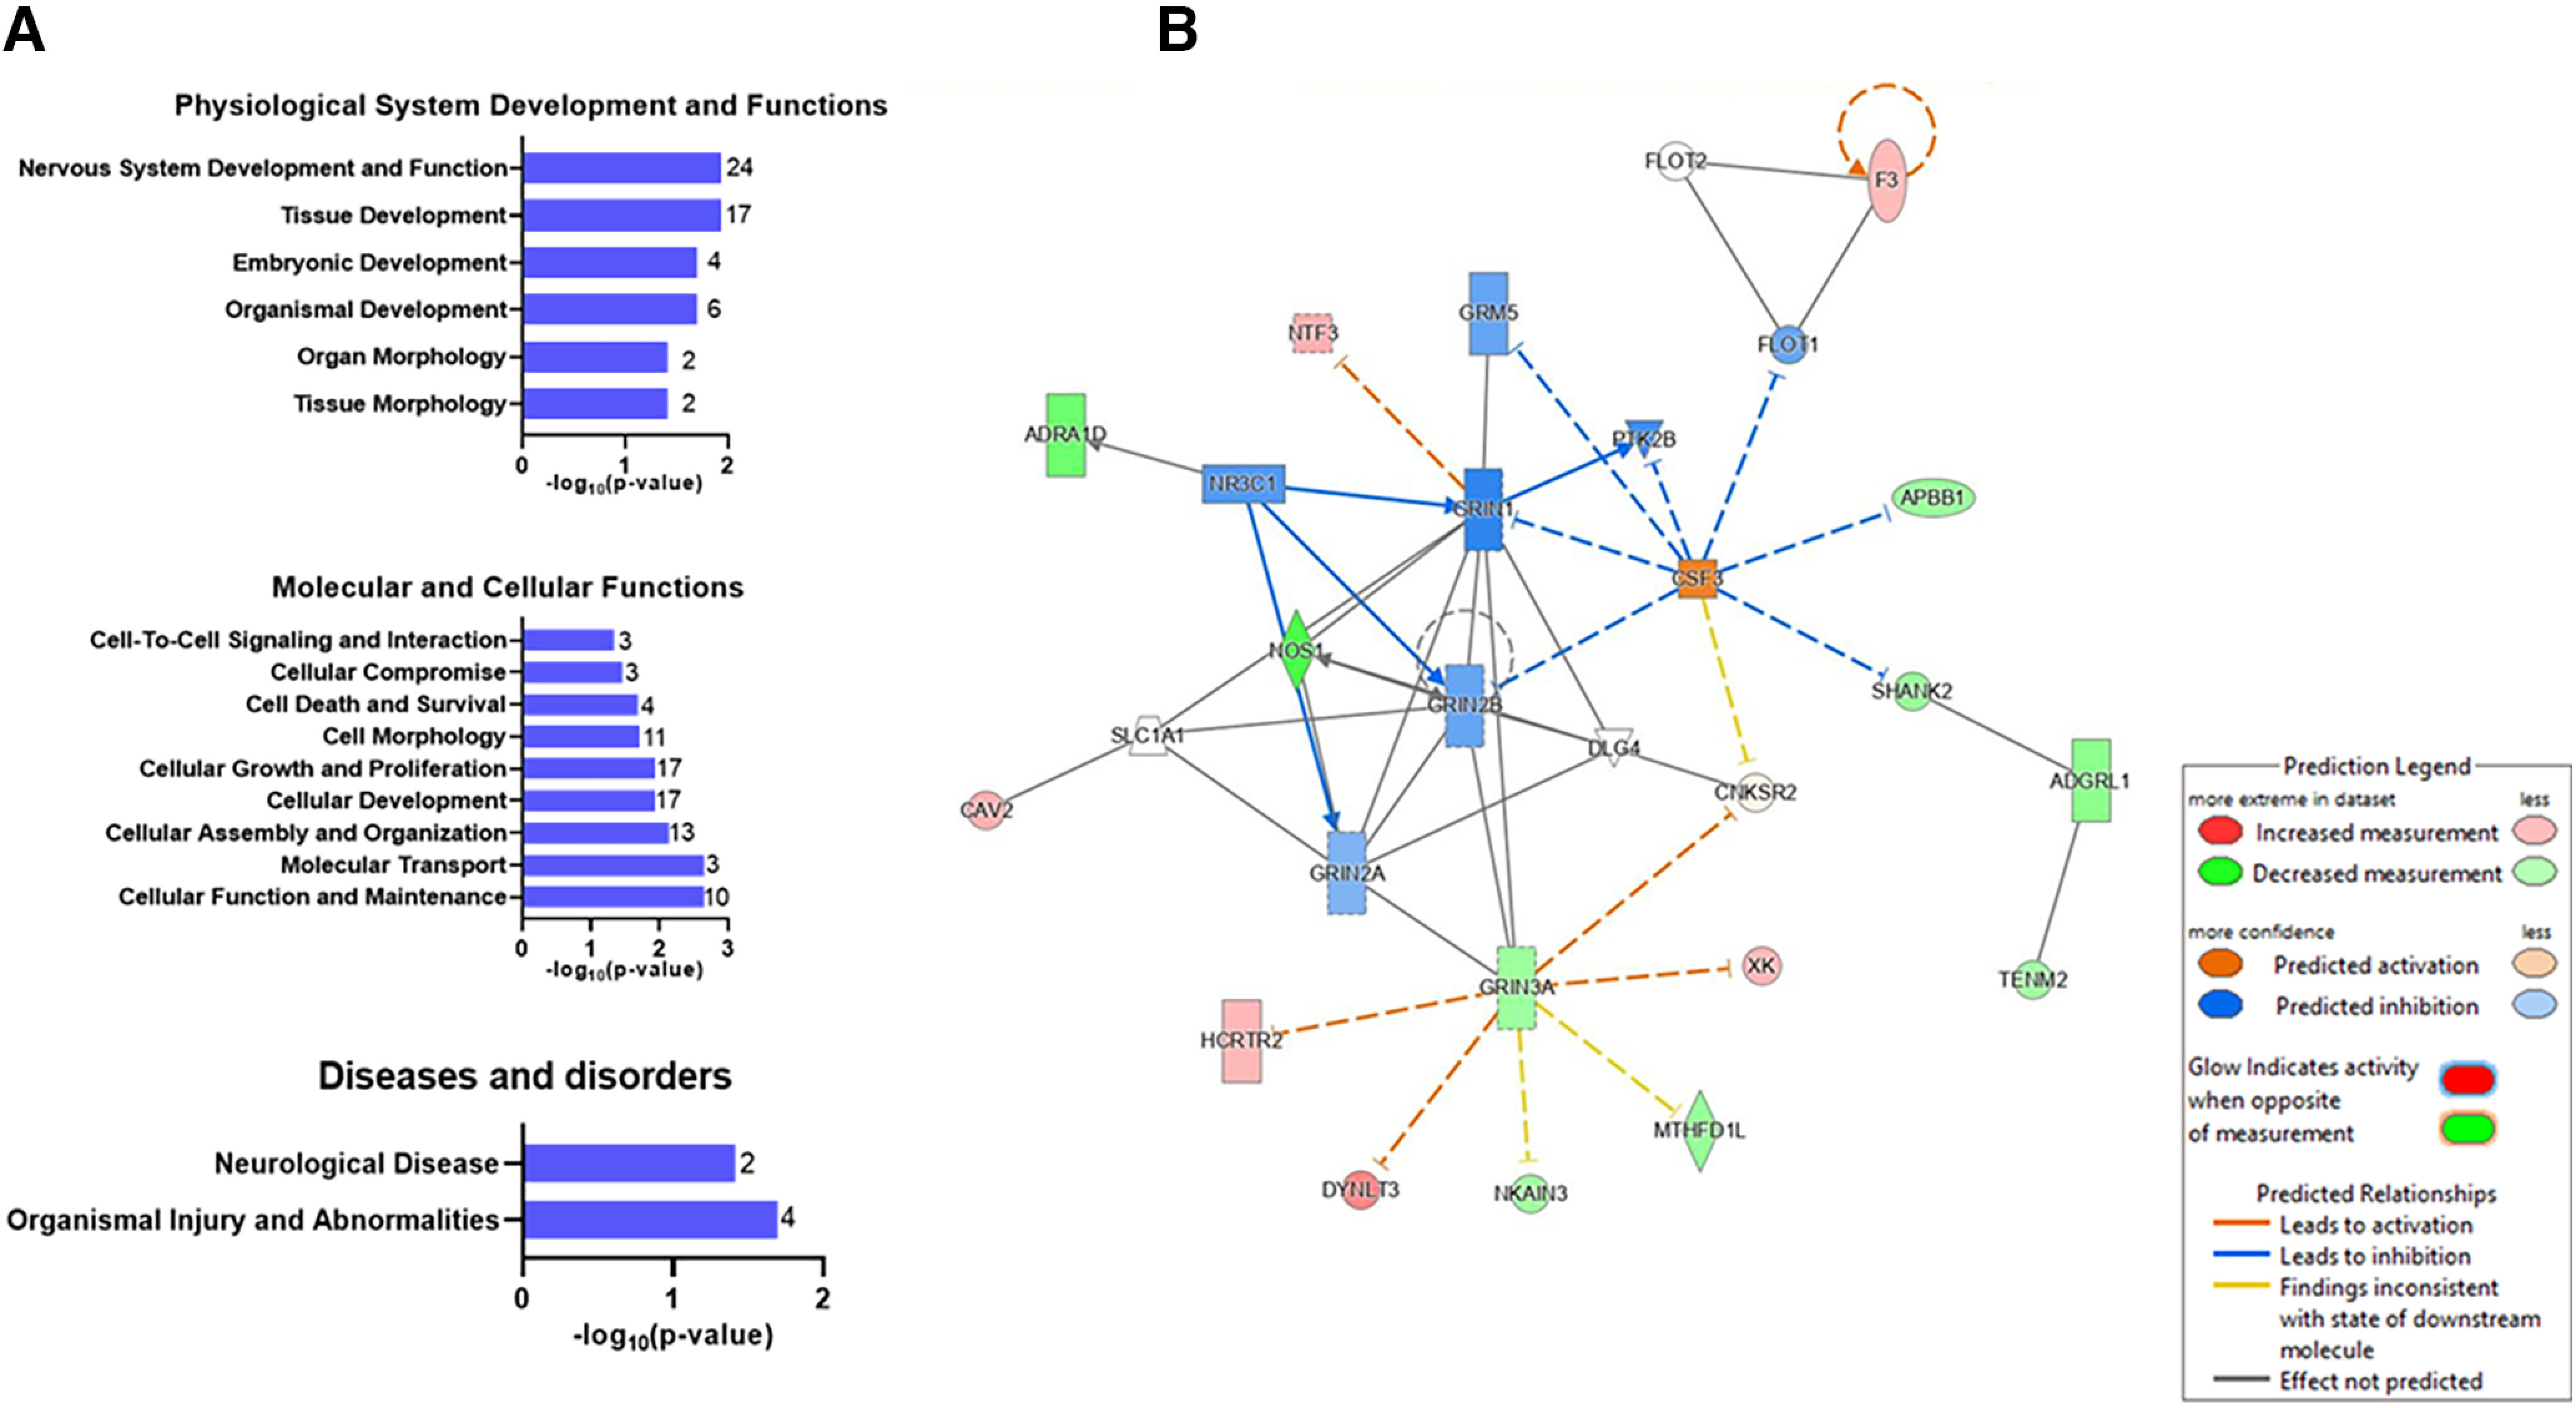
Figure 9.

Gene ontology analysis of RNA-Seq analysis from amygdala samples detailed in Figure 8. A, Gene enrichment analysis of differentially expressed genes for biological and disease function identified perturbed pathways in physiological system development and functions, and molecular and cellular disease and disorders. Data are represented as -log10 of the lowest p-value of an associated pathway. Values at the end of each bar represent the number of differentially expressed genes in each Gene Ontology category. B, Gene interaction network map. This network consists of the top 2 ranked networks of differentially expressed genes linked to neurologic disease, organismal injuries and abnormalities, and psychological disorders. See Extended Data Table 8-2, C and D, for additional details.
