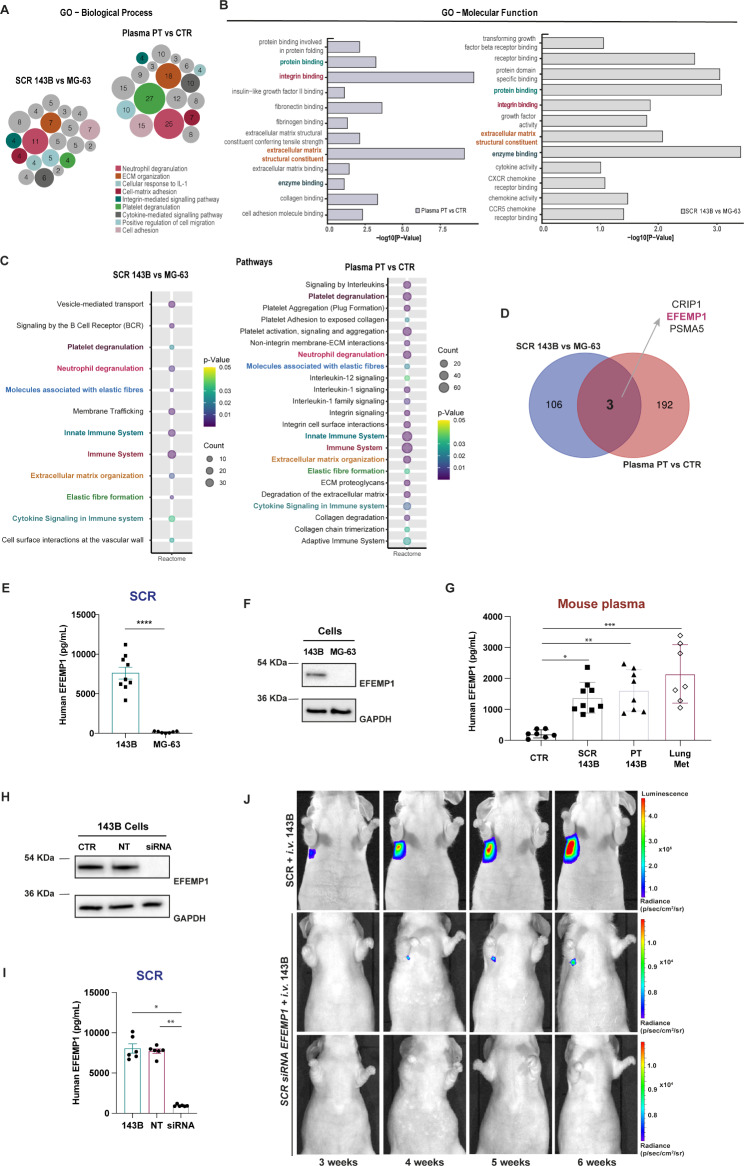
Fig. 5.
Proteomic analysis identified EFEMP1 as a potential metastatic-related biomarker in osteosarcoma. A, B Gene ontology analysis (GO) output. Biological process (BP) and molecular function (MF) of differently expressed proteins (DEPs) in the two pairwise-comparison groups (SCR 143B vs. MG-63; Plasma PT vs. CTR). Circle sizes in BP denote the number of genes involved in the process. C Reactome pathway enrichment analysis of identified proteins in the two pairwise- comparison groups. Circle sizes denote the number of genes included in a group and colour indicates the p-value. The common pathways are highlighted. D Venn diagram showing specific and common proteins among the two pairwise groups: SCR 143B vs. MG-63 and Plasma PT vs. CTR. E EFEMP1 levels in the SCR of the metastatic 143B and non-metastatic MG-63 OS cells. F Representative western blot of EFEMP1 in the metastatic 143B and non-metastatic MG-63 OS cells. G Plasma levels of EFEMP1 in control mice (CTR), mice treated with the 143B SCR, bearing a primary tumour (PT) or with lung metastasis (Lung Met). H Representative western blot of EFEMP1 expression in 143B cells (CTR), non-targeting (NT) and siRNA knockdown of EFEMP1 cells. I EFEMP1 levels in the SCR of 143B cells, NT and siRNA EFEMP1-knockdown cells. J Representative bioluminescence images of mice treated with the SCR of control 143B (SCR + i.v. group) or EFEMP1-knockdown cells (SCR siRNA EFEMP1 + i.v. group) followed i.v. injection of 143B-Luc+ cells. Data are presented as mean ± SEM, from 7 to 8 independent experiments. **** p < 0.0001 were significantly different when compared with the SCR from MG-63 (unpaired t-test (E)); *p < 0.05, **p < 0.01 and ***p < 0.001 were significantly different when compared with the values present in the plasma from healthy mice (Kruskal-Wallis test (G); *p < 0.05, **p < 0.01 were significantly different when compared with 143B SCR (Kruskal-Wallis test (I))

