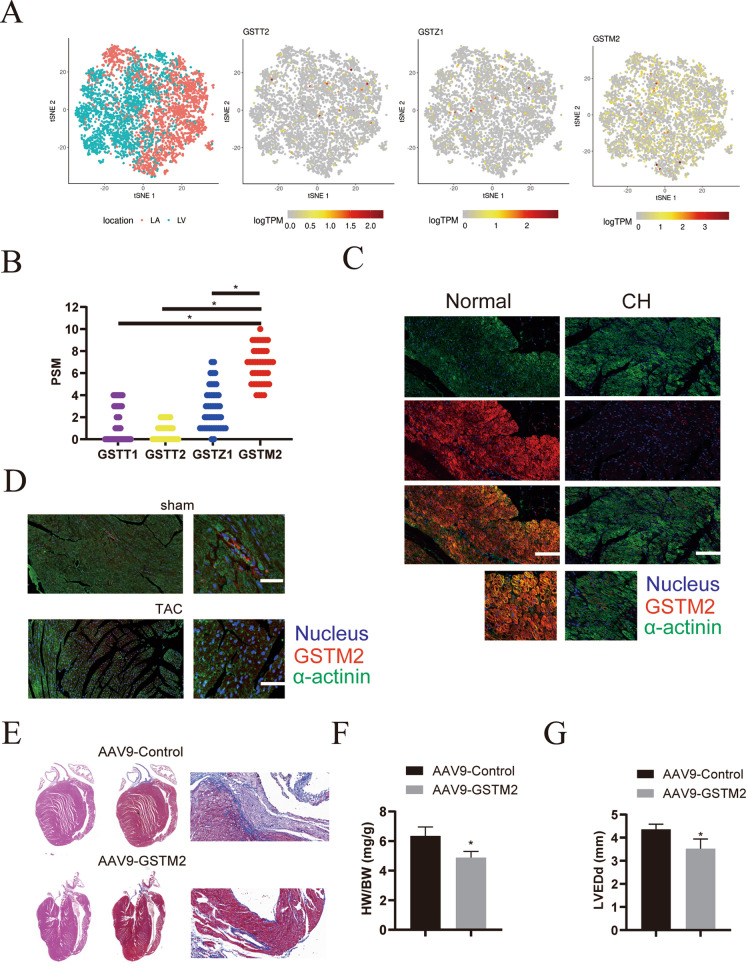
Fig. 5.
Analysis of the differentially expressed genes in samples from heart failure patients. A 2D visualization of GSTT2, GSTZ1 and GSTM2 gene expression in the LV and LA. B Analysis of GSTT2, GSTZ1 and GSTM2 protein abundances according to proteomics. C Immunofluorescence analysis of GSTM2 (red) expression in cardiomyocytes (stained with the cardiomyocyte marker α-actinin, green) from clinical human cardiac hypertrophy (CH) tissues and normal heart tissues. The nuclei were stained with DAPI (blue). Scale bar: 200 μm. D Immunofluorescence analysis of GSTM2 (red) expression in cardiomyocytes (stained with the cardiomyocyte marker α-actinin, green) from the heart tissues of sham or TAC model mice. The nuclei were stained with DAPI (blue). Scale bar: 100 μm. E Representative Masson staining results to assess fibrosis in heart tissues from mice injected with AAV9-GSTM2 or control AAV9 via the tail vein for 3 weeks, then subjected to TAC, and analyzed 4 weeks later. F Statistical analysis of the heart weight (HW)/body weight (BW) ratios of mice subjected to TAC surgery 4 weeks after surgery (n = 6 mice per group; *p < 0.05 versus sham group). G Assessment of left ventricular end-diastolic diameter (LVEDd) in mice, n = 6. *p < 0.05

