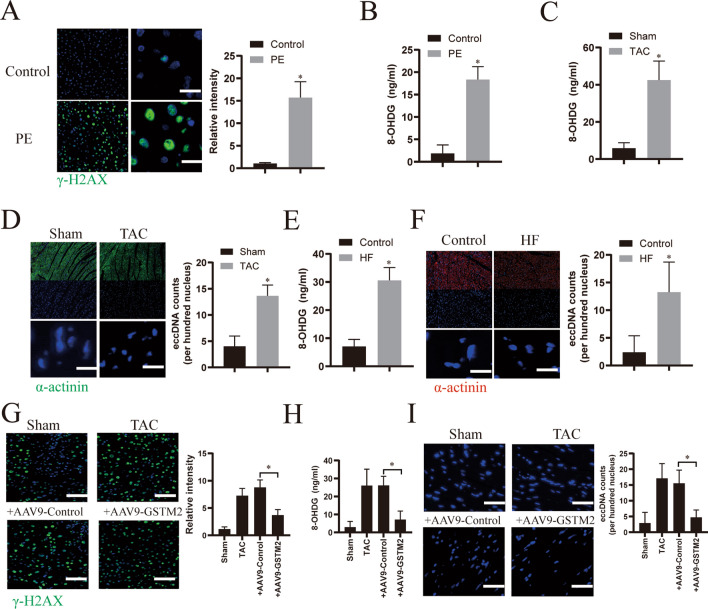
Fig. 6.
GSTM2 attenuates DNA damage in hypertrophic heart tissues. A Immunofluorescence analysis of γ-H2AX (green) in primary cardiomyocytes stimulated with phenylephrine (PE, 50 μmol/l), or DMSO (as a control) for 24 h. Nuclei were stained with DAPI (blue). Scale bar: 50 μm. B Assessment of the 8-OHDG contents in the culture supernatants from PE- or DMSO (as a control)-treated cardiomyocytes. n = 6. *p < 0.05. C Assessment of the 8-OHDG contents in the heart tissues of sham or TAC model mice. n = 6. *p < 0.05. D Representative confocal immunofluorescence images of cardiomyocytes (α-actinin, green) from heart tissues of sham or TAC model mice. The nuclei were stained with DAPI (blue). eccDNA was quantified by analyzing the intensity of DAPI outside nuclei. *p < 0.05. Scale bar: 100 μm. E Assessment of the 8-OHDG contents in clinical human heart failure (HF) tissues and normal heart tissues (as control). n = 3. *p < 0.05. F Representative confocal immunofluorescence images of cardiomyocytes (α-actinin, red) from clinical human HF tissues and normal heart tissues (as control). The nuclei were stained with DAPI (blue). eccDNA was quantified by analyzing the intensity of DAPI outside the nuclei. *p < 0.05. Scale bar: 100 μm. G Immunofluorescence analysis of γ-H2AX (green) in primary cardiomyocytes infected with AAV9-GSTM2 or control AAV9 for 48 h and then treated with PE for 24 h. Scale bar: 200 μm. H Assessment of the 8-OHDG content in the culture supernatants from cardiomyocytes infected with AAV9-GSTM2 or control AAV9 for 48 h and then treated with PE for 24 h. n = 6. *p < 0.05. I Representative confocal immunofluorescence images of cardiomyocytes (α-actinin, green) from the heart tissues of TAC model mice infected with AAV9-GSTM2 or control AAV9. The nuclei were stained with DAPI (blue). eccDNA was quantified by analyzing the intensity of DAPI outside the nuclei. *p < 0.05. Scale bar: 100 μm

