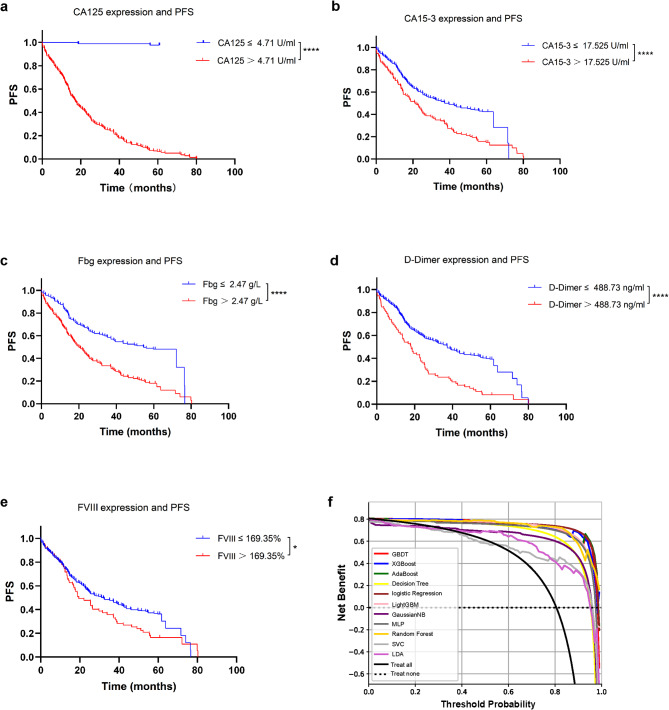
Fig. 5.
Kaplan‒Meier plots and decision curve analysis (DCA). (a–e) Kaplan‒Meier plot of progression-free survival (PFS) based on CA125, CA15-3, Fbg, D-Dimer and FVIII expression (*p < 0.05, ****p < 0.0001). (f) DCA of different ML algorithms. The y-axis measures the net benefit. The dotted line (Treat None) represents the net benefit of the prediction of nonrecurrence for all BC patients; the black line (Treat All) represents the net benefits of the outcomes of recurrence for all BC patients. The model with the highest clinical value was determined by quantifying net benefits under different thresholds

